Table 1. Harvard-Oxford Masks Results
| Rois |
Similarity Correls |
Class |
6-level ANOVA |
3-level ANOVA |
Num Voxels |
|
|---|
| Mask |
XSs-R |
Beh-R |
V1-R |
SVM-ac |
F(5) |
alpha |
F(2) |
alpha |
mean |
stdev |
Plots |
|---|
| LOC-I |
0.87 |
0.89 |
0.17 |
0.64 |
12.82 |
*** |
30.96 |
*** |
1347 |
121 |
LOC-I |
| TOcFus |
0.84 |
0.91 |
0.15 |
0.58 |
4.82 |
** |
8.62 |
** |
467 |
50 |
TOcFus |
| ITG-TO |
0.67 |
0.79 |
0.24 |
0.39 |
2.44 |
* |
0.84 |
|
472 |
30 |
ITG-TO |
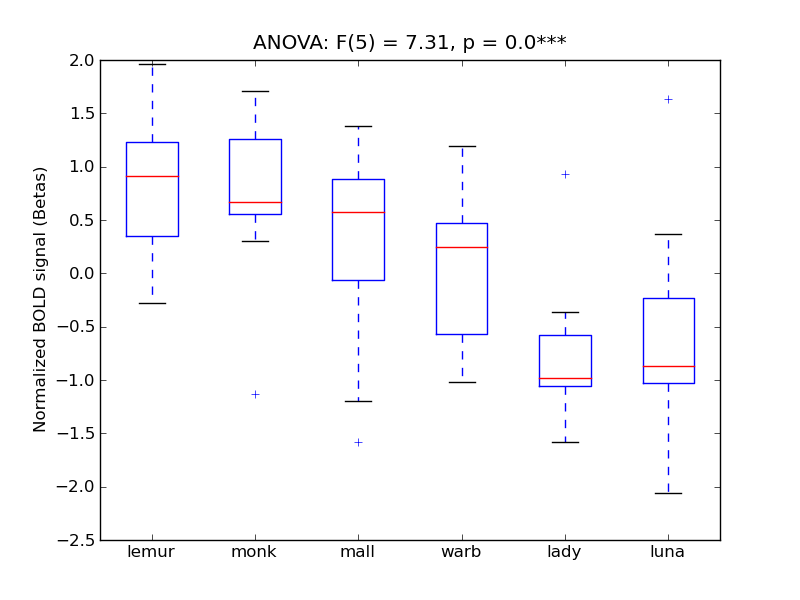
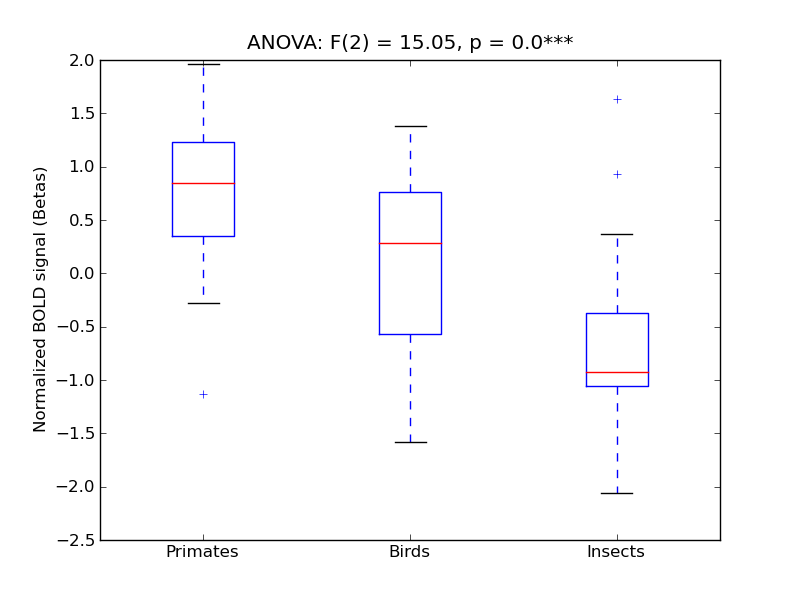
| MTG-TO |
0.64 |
0.8 |
0.19 |
0.41 |
7.31 |
*** |
15.05 |
*** |
596 |
45 |
MTG-TO |
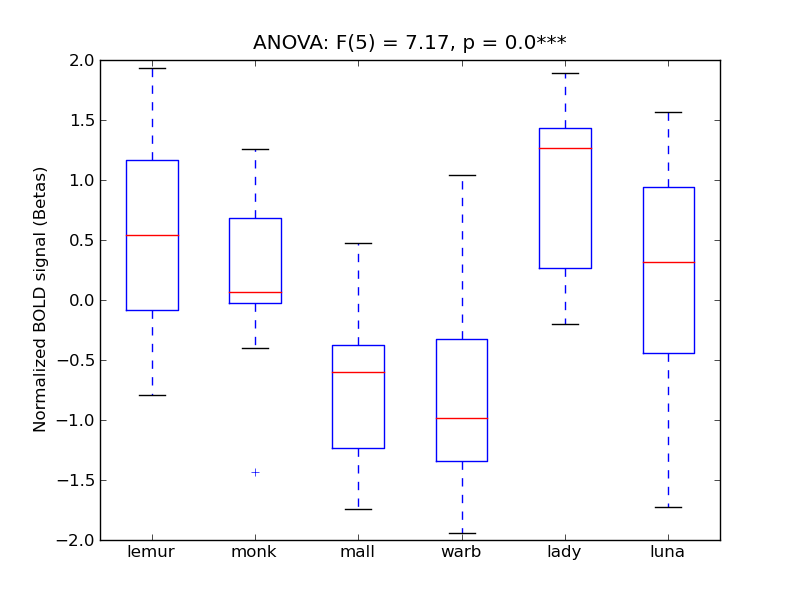
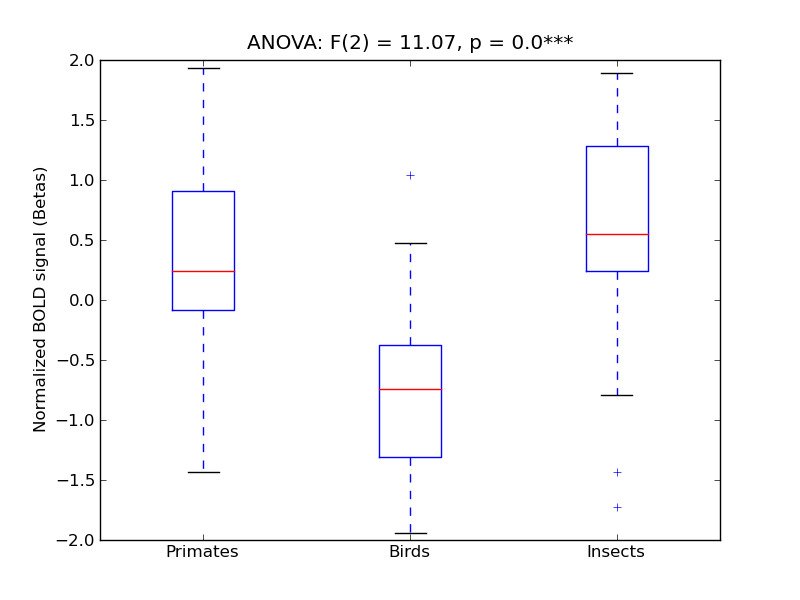
| OcFus |
0.63 |
0.85 |
0.14 |
0.62 |
7.17 |
*** |
11.07 |
*** |
664 |
64 |
OcFus |
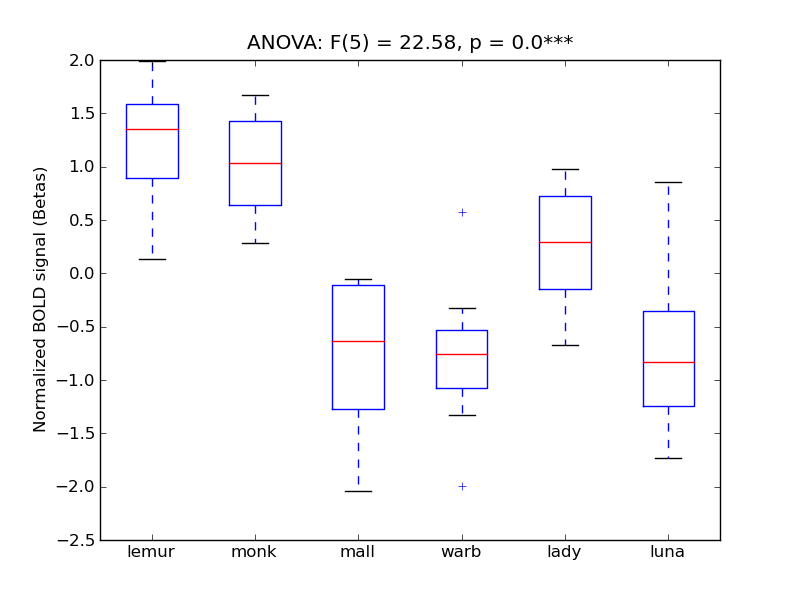
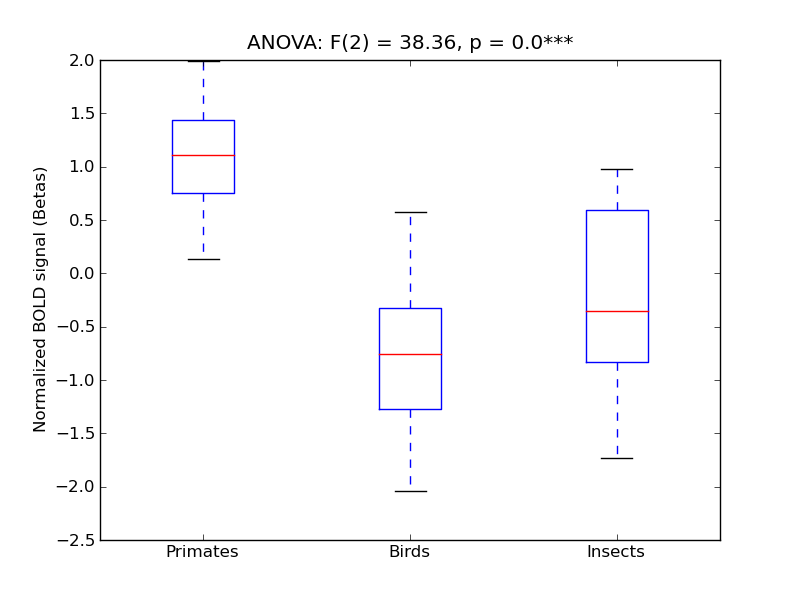
| OccPol |
0.62 |
0.14 |
0.91 |
0.68 |
22.58 |
*** |
38.36 |
*** |
1517 |
220 |
OccPol |
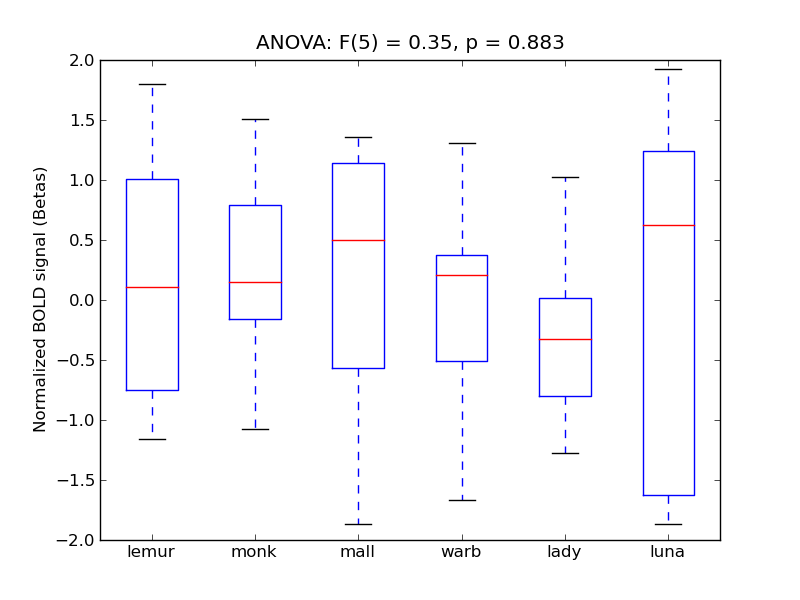
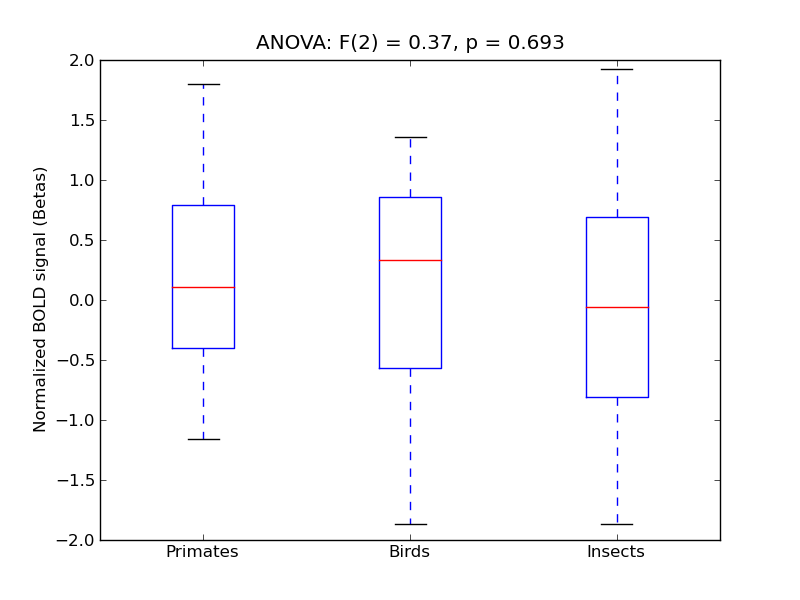
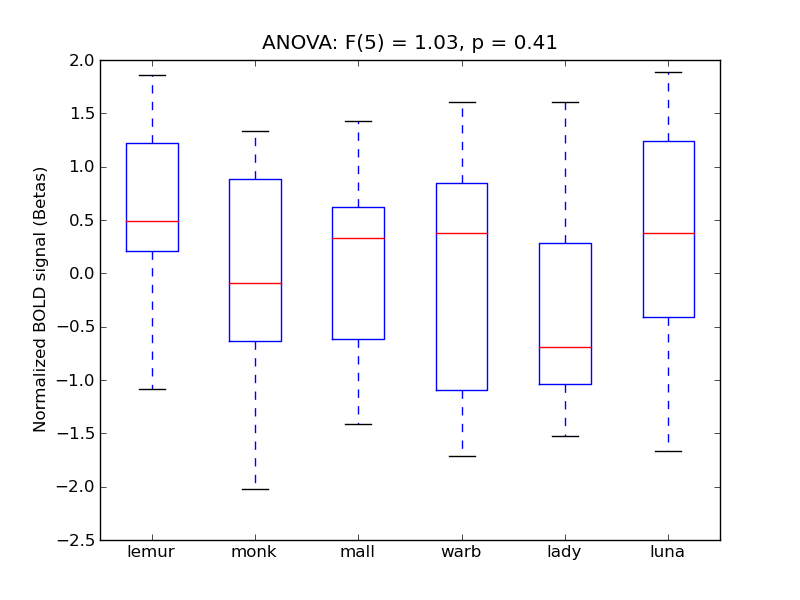
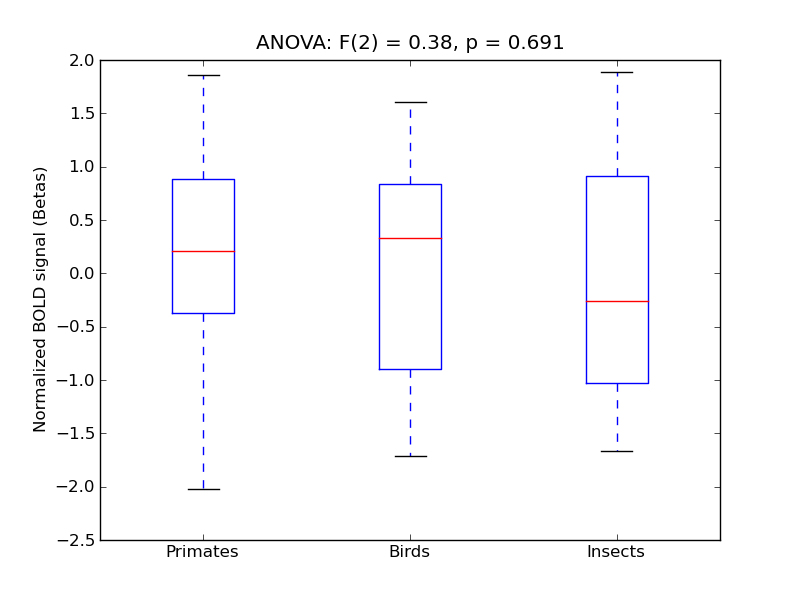
| LOC-S |
0.6 |
0.79 |
0.16 |
0.49 |
1.03 |
|
0.38 |
|
2126 |
202 |
LOC-S |
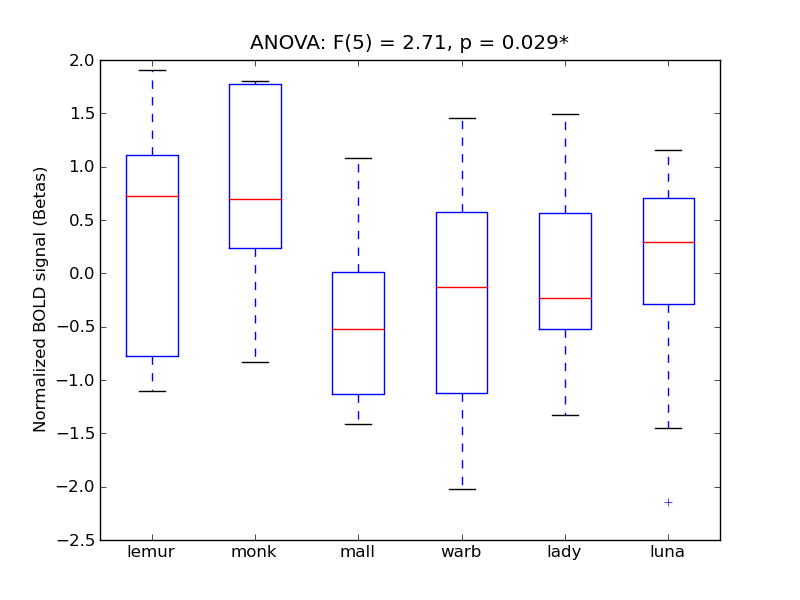
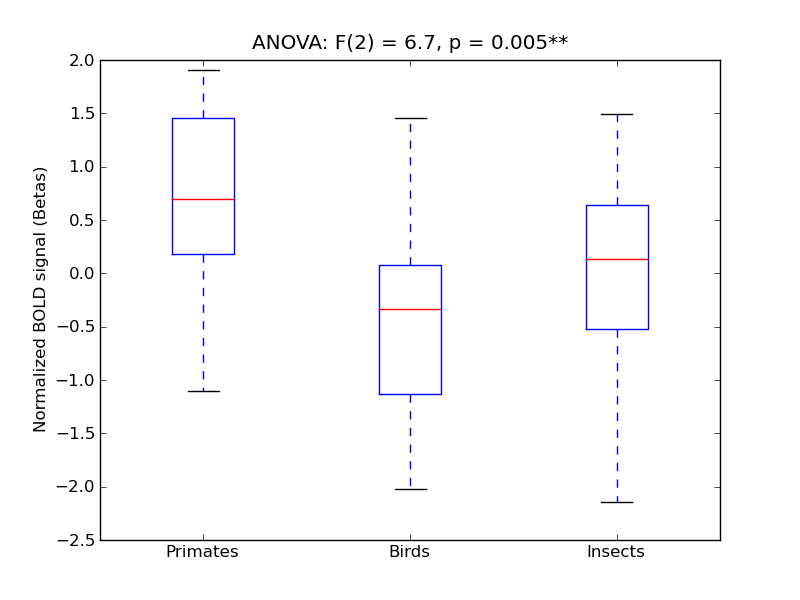
| Ling |
0.49 |
0.2 |
0.47 |
0.53 |
2.71 |
* |
6.7 |
** |
527 |
42 |
Ling |
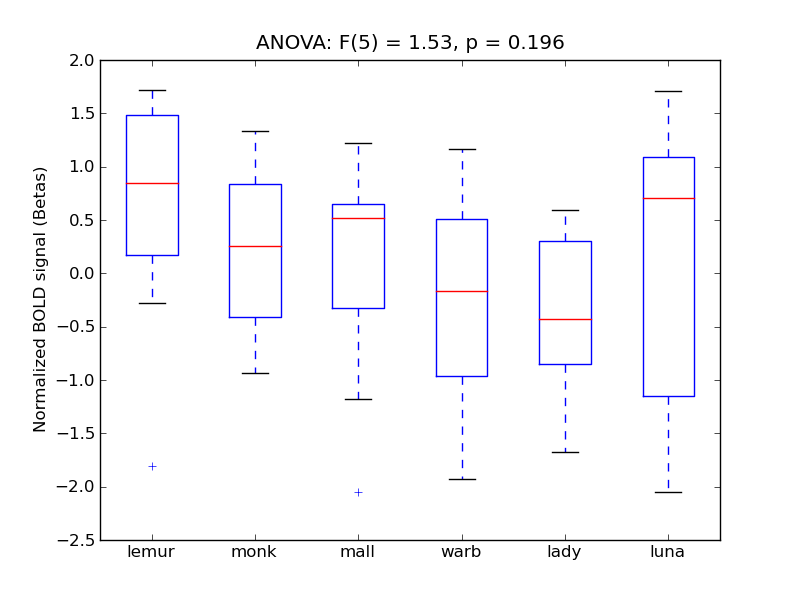
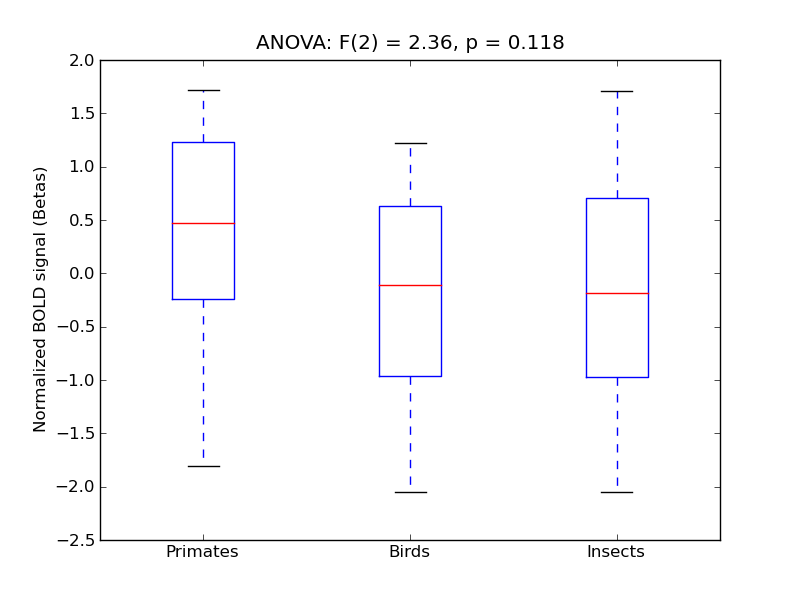
| TFus-P |
0.44 |
0.87 |
0.14 |
0.36 |
1.53 |
|
2.36 |
|
564 |
48 |
TFus-P |
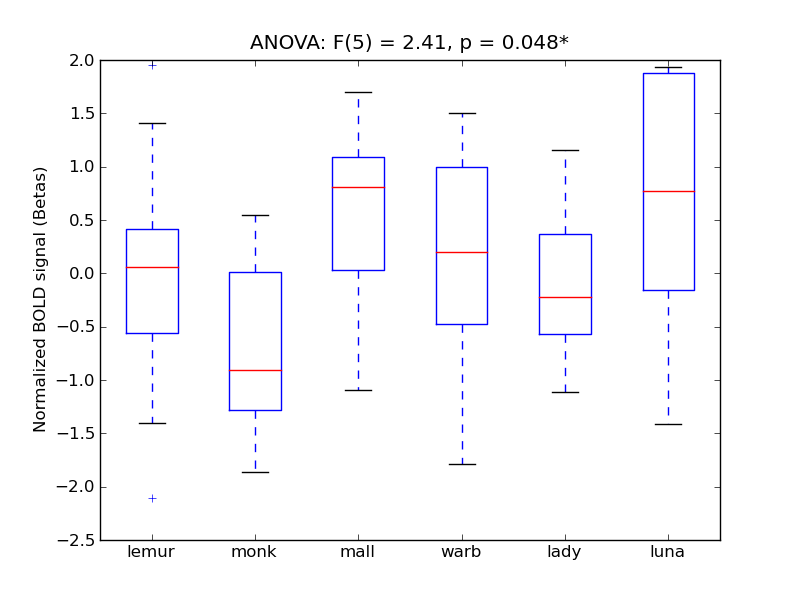
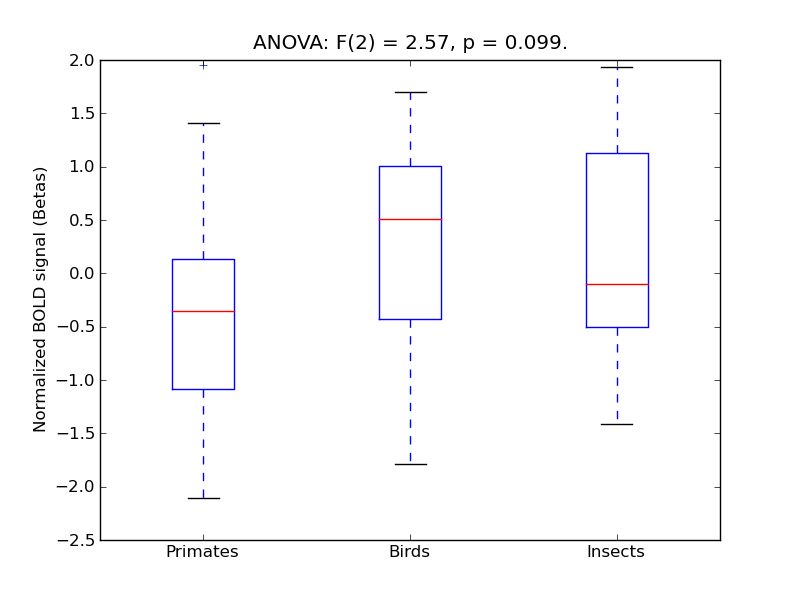
| SMG-P |
0.37 |
0.78 |
0.26 |
0.31 |
2.41 |
* |
2.57 |
<* |
685 |
44 |
SMG-P |
| IFG-PO |
0.31 |
0.64 |
-0.05 |
0.29 |
2.24 |
<* |
0.83 |
|
441 |
24 |
IFG-PO |
| SPLob |
0.31 |
0.44 |
0.2 |
0.38 |
1.72 |
|
0.19 |
|
654 |
65 |
SPLob |
| ITG-P |
0.28 |
0.72 |
0.26 |
0.22 |
2.3 |
<* |
4.4 |
* |
712 |
39 |
ITG-P |
| ICalC |
0.28 |
0.16 |
0.56 |
0.44 |
2.02 |
<* |
4.18 |
* |
398 |
31 |
ICalC |
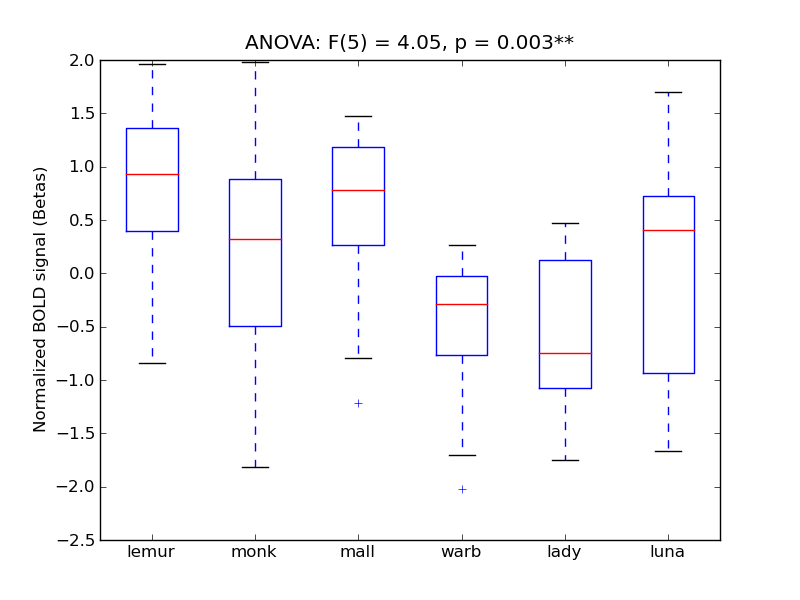
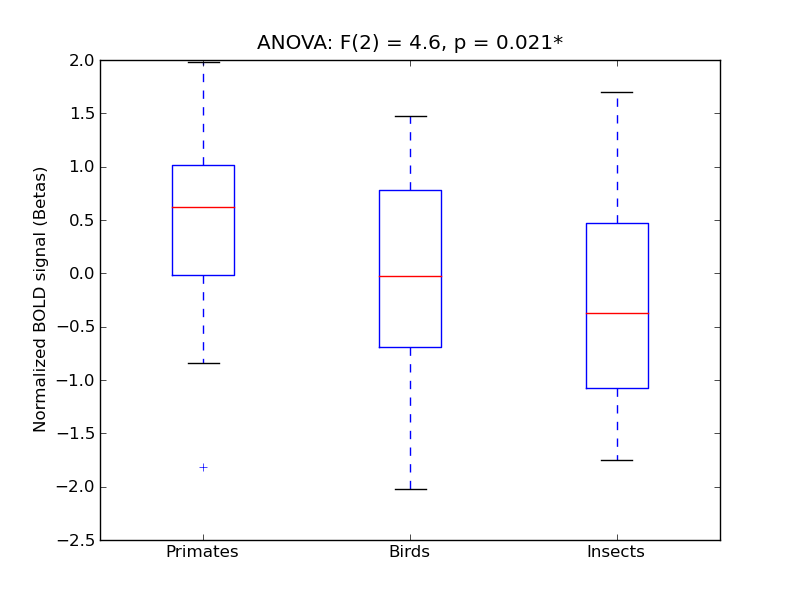
| IFG-PT |
0.27 |
0.65 |
0.21 |
0.25 |
4.05 |
** |
4.6 |
* |
414 |
32 |
IFG-PT |
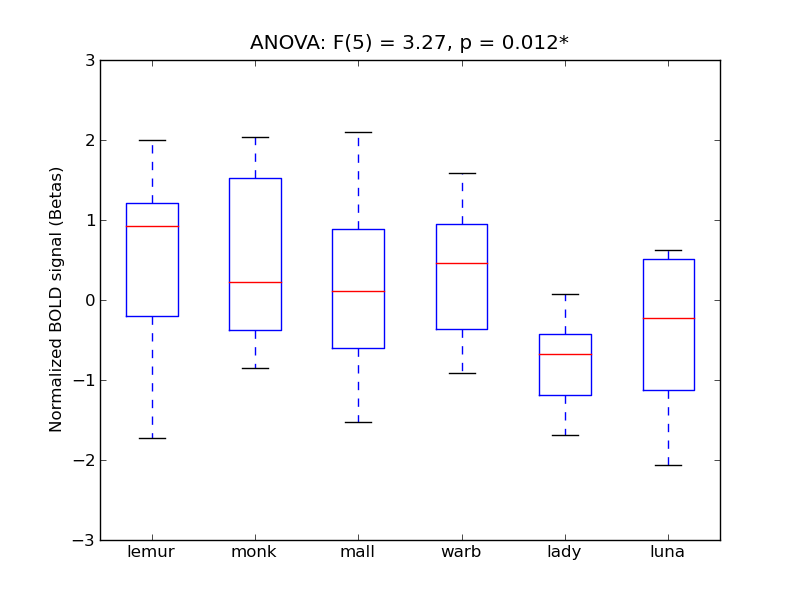
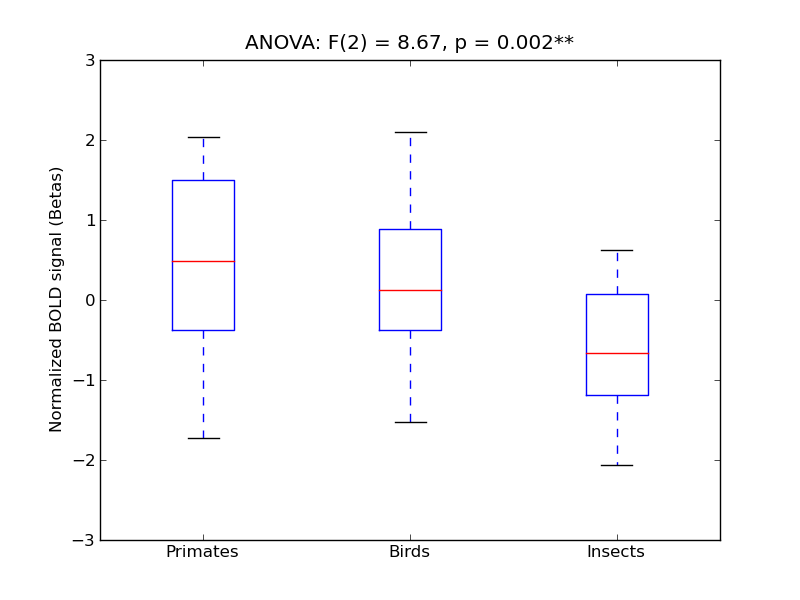
| Cuneal |
0.26 |
0.68 |
0.19 |
0.35 |
3.27 |
* |
8.67 |
** |
327 |
26 |
Cuneal |
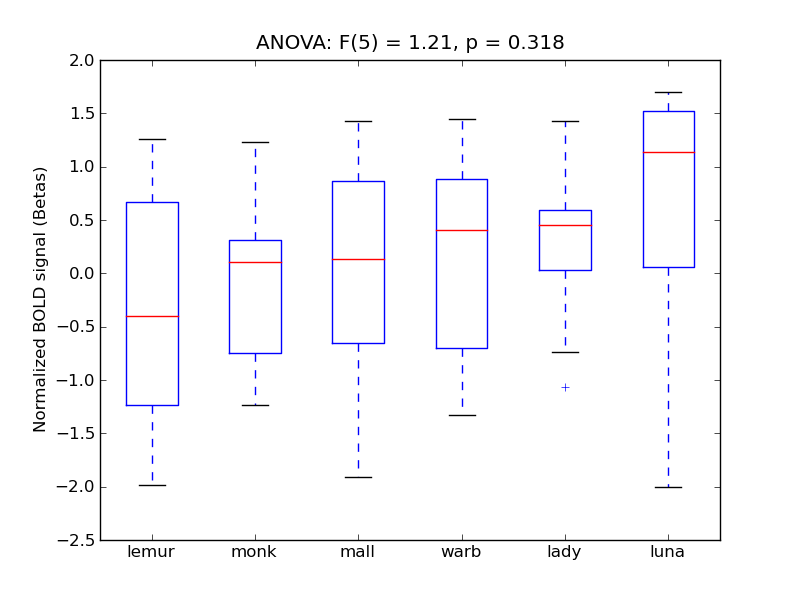
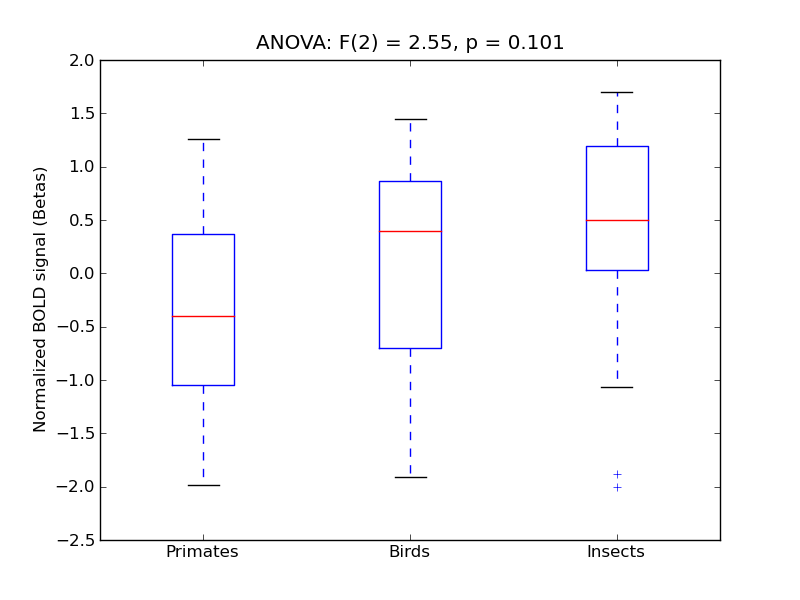
| STG-P |
0.21 |
0.51 |
0.12 |
0.22 |
1.21 |
|
2.55 |
|
404 |
24 |
STG-P |
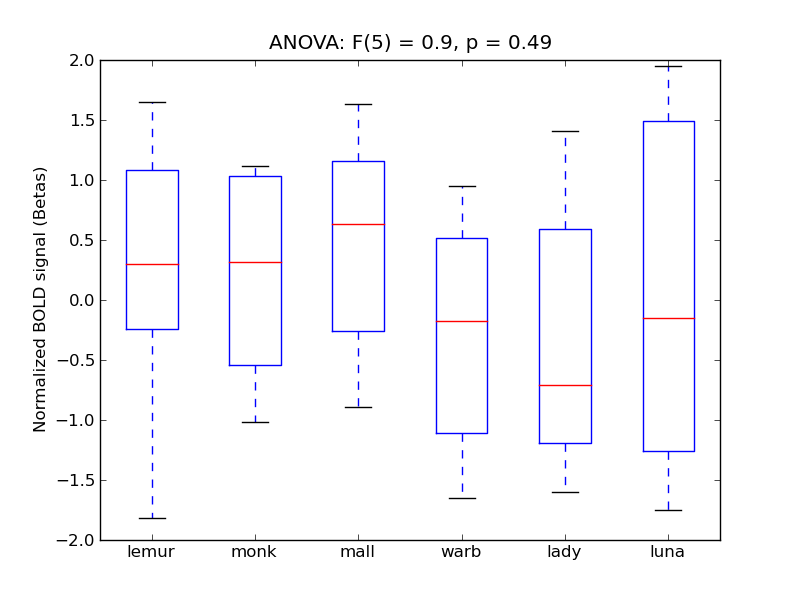
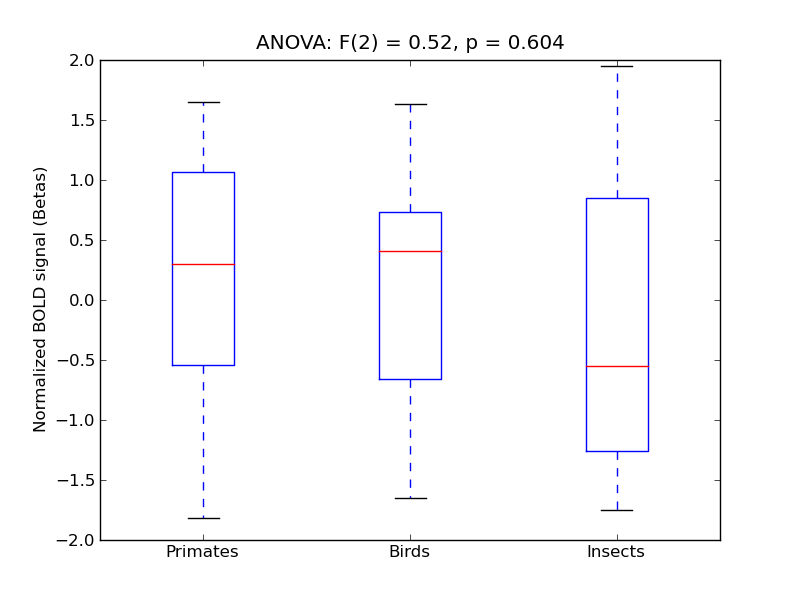
| FOper |
0.21 |
0.38 |
0.07 |
0.23 |
0.9 |
|
0.52 |
|
126 |
19 |
FOper |
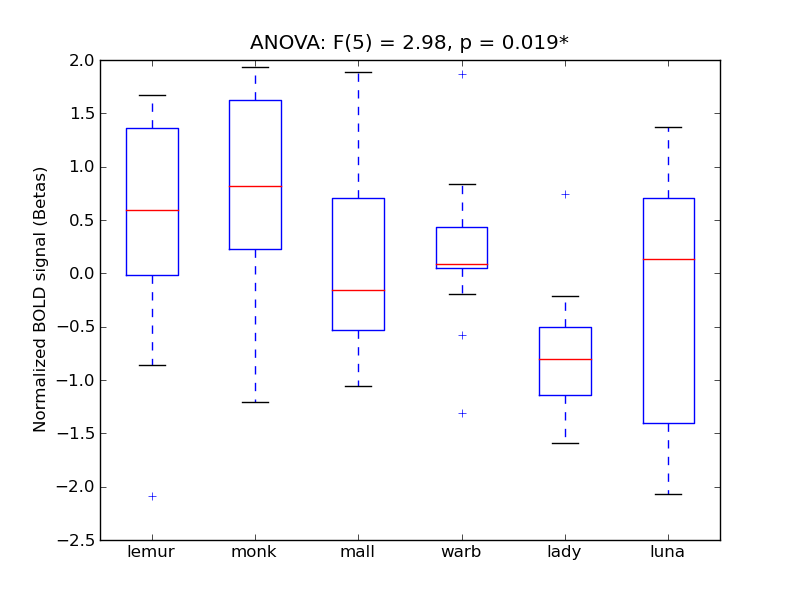
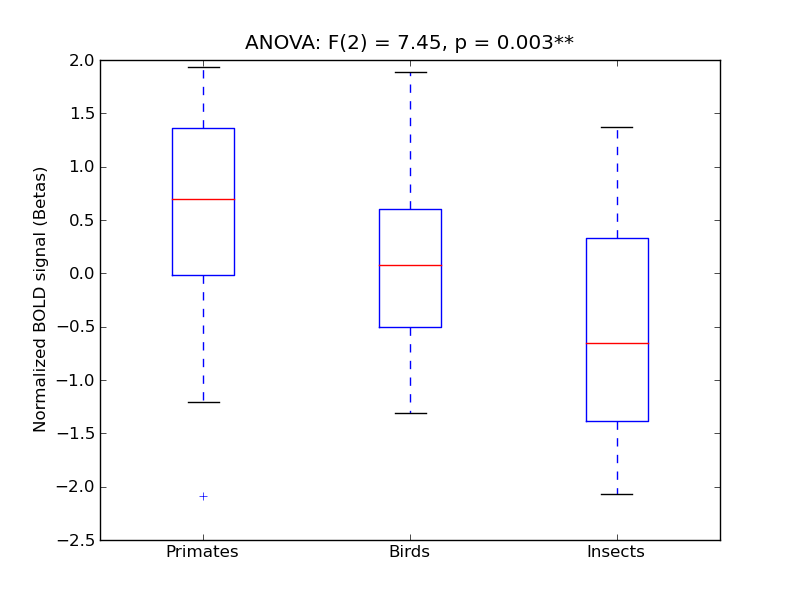
| SCalC |
0.2 |
0.59 |
0.32 |
0.36 |
2.98 |
* |
7.45 |
** |
83 |
10 |
SCalC |
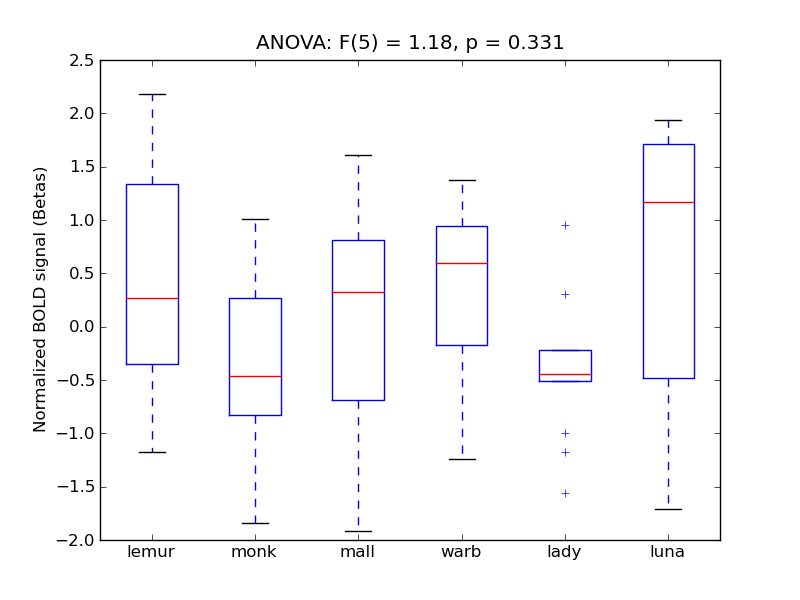
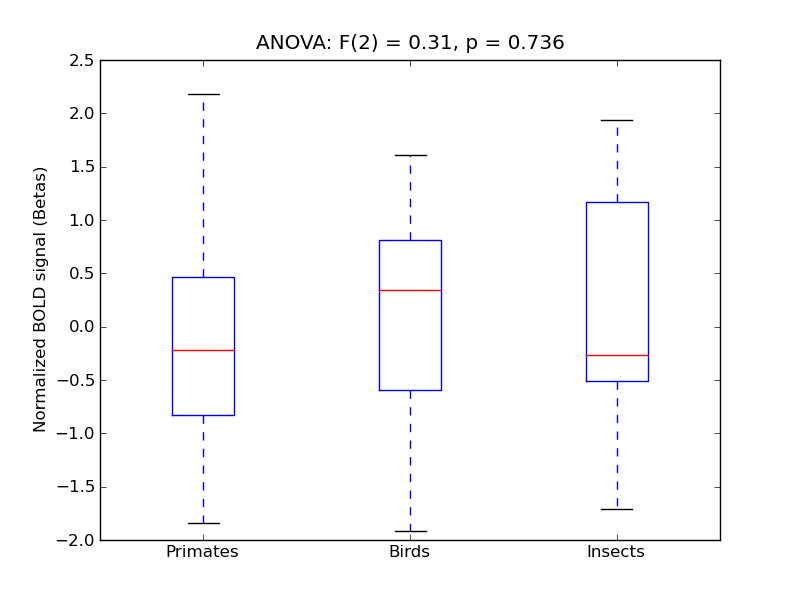
| POper |
0.19 |
0.73 |
0.32 |
0.26 |
1.18 |
|
0.31 |
|
234 |
39 |
POper |
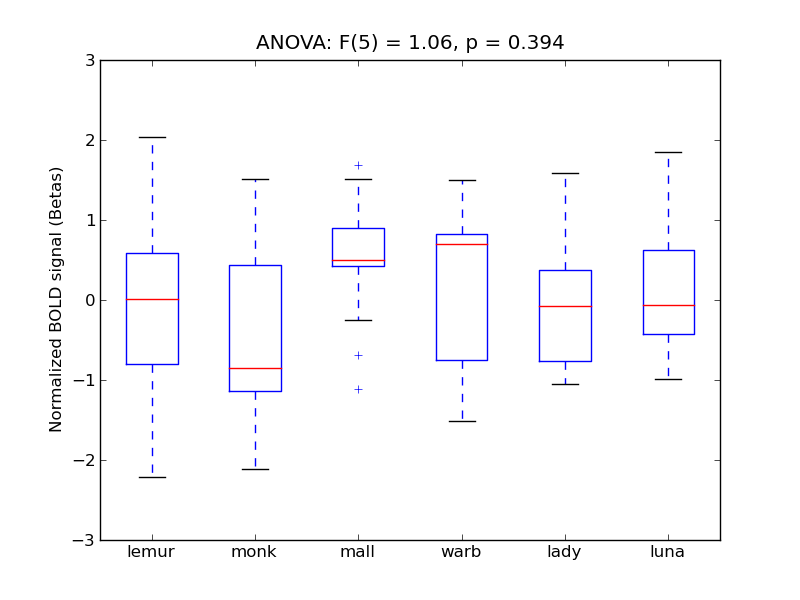
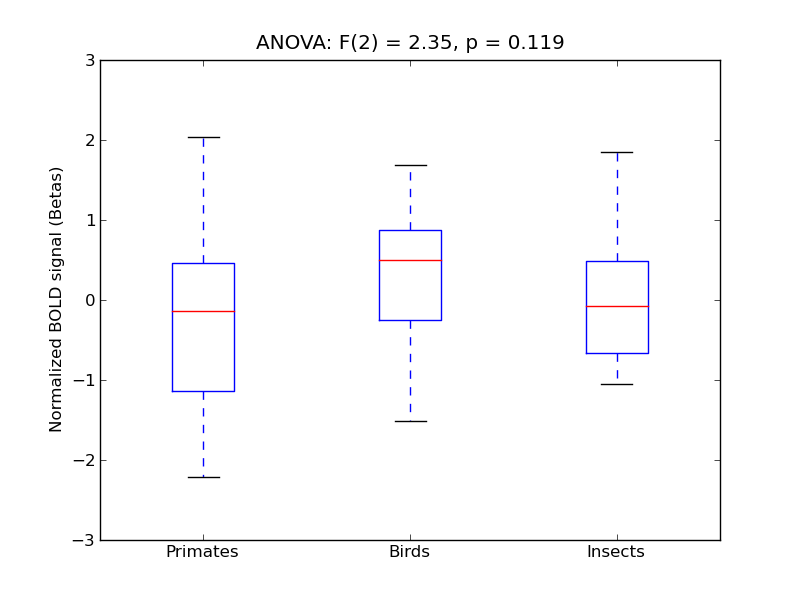
| AngG |
0.18 |
0.67 |
-0.01 |
0.26 |
1.06 |
|
2.35 |
|
645 |
52 |
AngG |
| PTempo |
0.17 |
0.6 |
0.15 |
0.25 |
1.28 |
|
0.97 |
|
305 |
35 |
PTempo |
| TemPol |
0.16 |
0.3 |
-0.13 |
0.21 |
1.65 |
|
3.69 |
* |
1612 |
113 |
TemPol |
| FOrb |
0.16 |
0.1 |
0.23 |
0.21 |
1.34 |
|
1.06 |
|
889 |
71 |
FOrb |
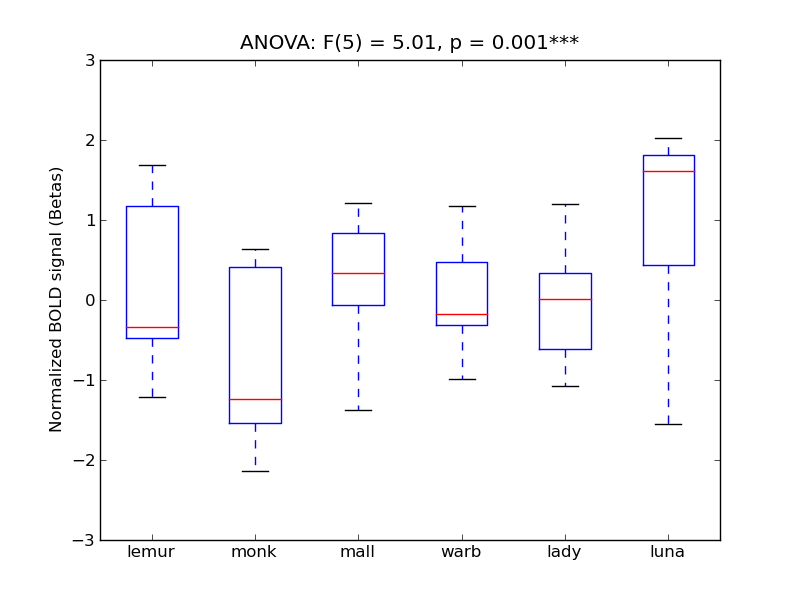
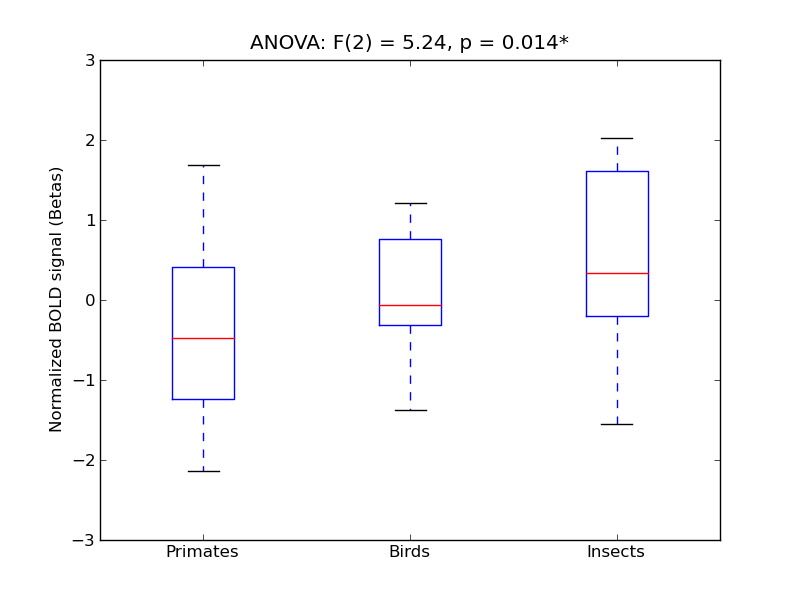
| SMG-A |
0.16 |
0.58 |
0.04 |
0.32 |
5.01 |
*** |
5.24 |
* |
484 |
42 |
SMG-A |
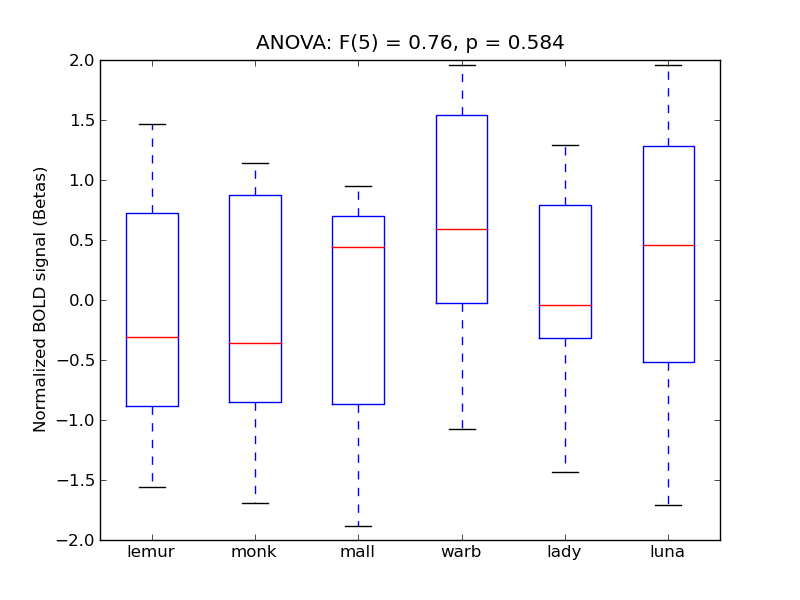
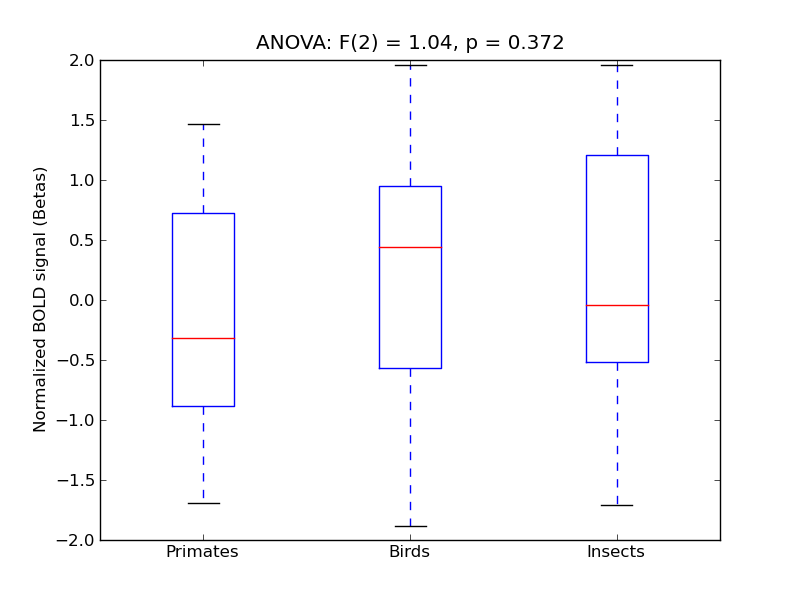
| MTG-P |
0.14 |
0.54 |
0.24 |
0.22 |
0.76 |
|
1.04 |
|
851 |
60 |
MTG-P |
| PreCG |
0.14 |
0.36 |
-0.04 |
0.29 |
0.4 |
|
0.05 |
|
2192 |
231 |
PreCG |
| Precun |
0.1 |
0.63 |
0.1 |
0.3 |
2.14 |
<* |
7.12 |
** |
1331 |
126 |
Precun |
| STG-A |
0.09 |
0.54 |
-0.02 |
0.2 |
0.28 |
|
0.76 |
|
211 |
13 |
STG-A |
| MFG |
0.09 |
0.47 |
-0.07 |
0.25 |
1.89 |
|
1.83 |
|
1310 |
153 |
MFG |
| PHip-P |
0.09 |
0.14 |
0.14 |
0.2 |
0.71 |
|
0.91 |
|
366 |
27 |
PHip-P |
| PostCG |
0.08 |
0.21 |
0.22 |
0.29 |
0.41 |
|
0.21 |
|
1606 |
168 |
PostCG |
| FrPole |
0.08 |
0.52 |
-0.04 |
0.21 |
0.77 |
|
0.77 |
|
3555 |
386 |
FrPole |
| SFG |
0.08 |
0.55 |
-0.22 |
0.2 |
0.22 |
|
0.36 |
|
1278 |
167 |
SFG |
| COper |
0.07 |
0.13 |
0.34 |
0.19 |
1.0 |
|
1.79 |
|
361 |
41 |
COper |
| Cing-P |
0.06 |
0.4 |
0.32 |
0.22 |
0.24 |
|
0.26 |
|
806 |
65 |
Cing-P |
| Subcal |
0.04 |
-0.06 |
0.45 |
0.17 |
0.4 |
|
0.17 |
|
384 |
26 |
Subcal |
| Cing-A |
0.03 |
0.07 |
0.05 |
0.18 |
0.36 |
|
0.07 |
|
794 |
74 |
Cing-A |
| JuxtLC |
0.03 |
0.34 |
-0.03 |
0.16 |
0.35 |
|
0.37 |
|
357 |
26 |
JuxtLC |
| TFus-A |
0.02 |
0.49 |
0.24 |
0.22 |
2.02 |
<* |
2.32 |
|
217 |
27 |
TFus-A |
| MTG-A |
0.02 |
0.47 |
0.36 |
0.21 |
0.99 |
|
0.2 |
|
279 |
21 |
MTG-A |
| InsCtx |
0.01 |
0.42 |
-0.03 |
0.22 |
0.4 |
|
0.61 |
|
714 |
81 |
InsCtx |
| PCing |
0.01 |
-0.12 |
0.13 |
0.18 |
2.17 |
<* |
2.25 |
|
708 |
45 |
PCing |
| PHip-A |
0.0 |
0.3 |
0.23 |
0.21 |
1.53 |
|
2.71 |
<* |
655 |
48 |
PHip-A |
| ITG-A |
-0.02 |
0.19 |
-0.13 |
0.21 |
0.11 |
|
0.14 |
|
239 |
21 |
ITG-A |
| PPolar |
-0.02 |
0.26 |
0.03 |
0.2 |
0.39 |
|
0.9 |
|
245 |
19 |
PPolar |
| FMedC |
-0.02 |
0.37 |
0.32 |
0.16 |
0.58 |
|
0.71 |
|
304 |
23 |
FMedC |
| Heschl |
-0.06 |
0.19 |
-0.04 |
0.17 |
0.58 |
|
1.62 |
|
166 |
15 |
Heschl |
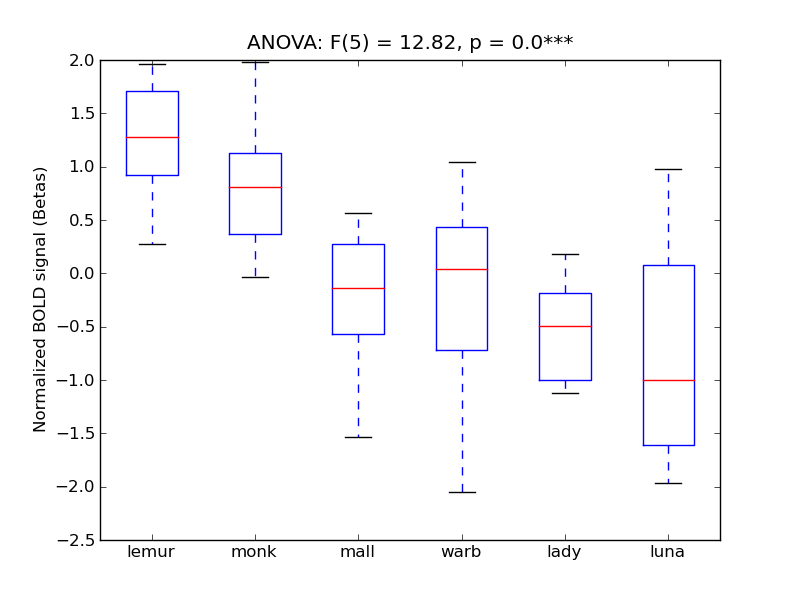
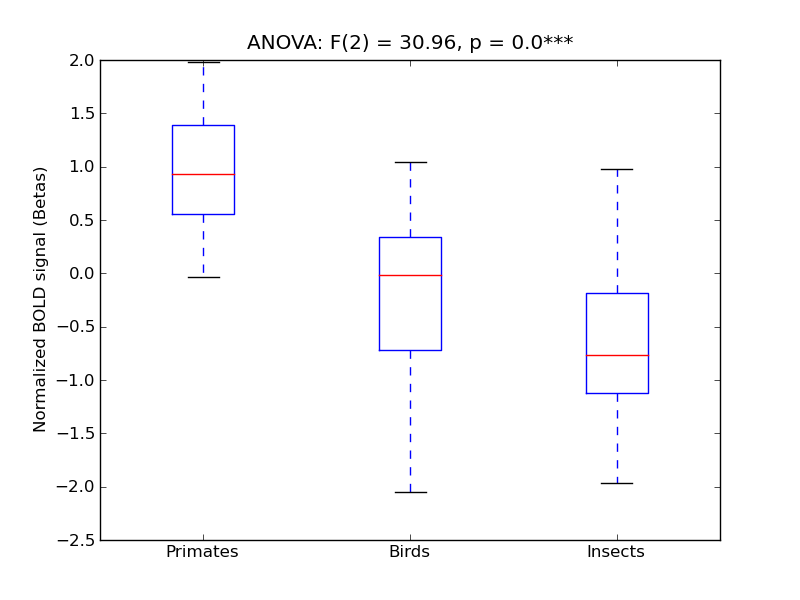
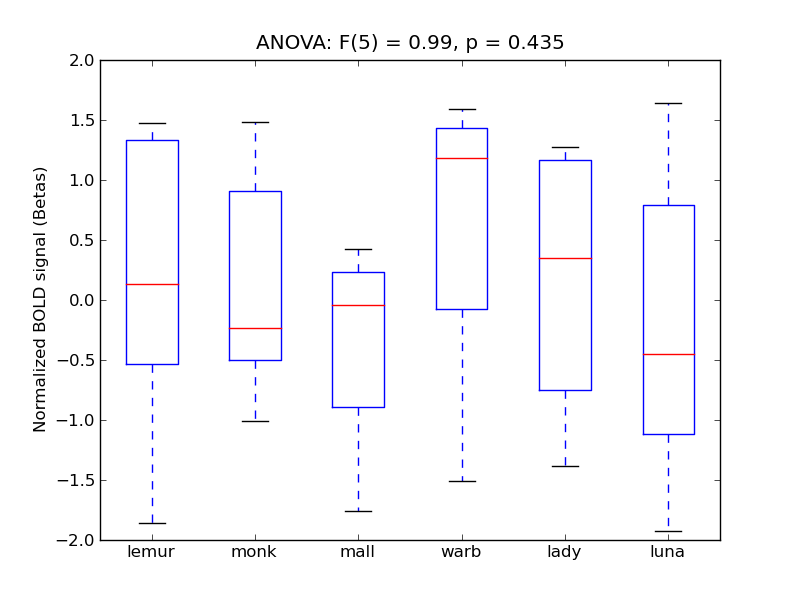
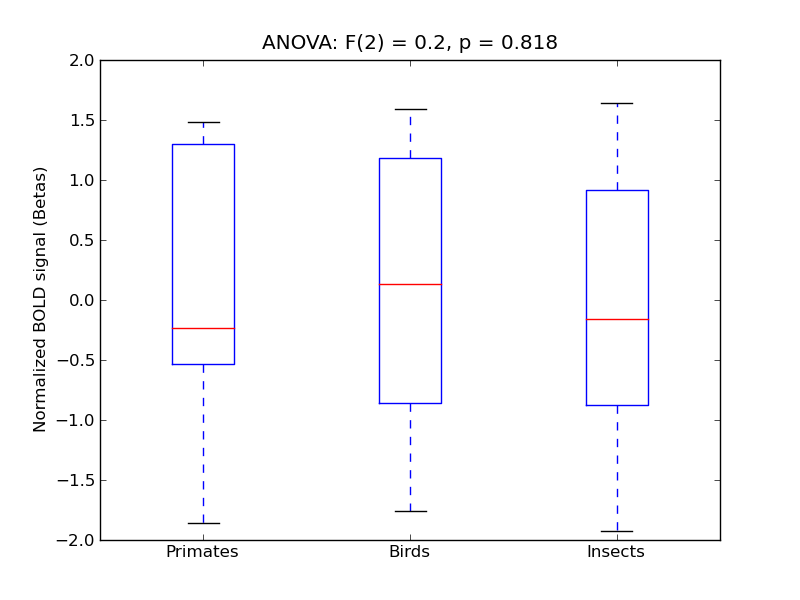
Lateral Occipital Cortex, inferior division
- <click back to table>
- Cross-Subject Similarity correlation: 0.87
- Correlation with behavioral similarity: 0.89
- Correlation with V1 model similarity: 0.17
- SVM Accuracy: 0.64
- Number of voxels in mask: mean = 166, stdev = 15
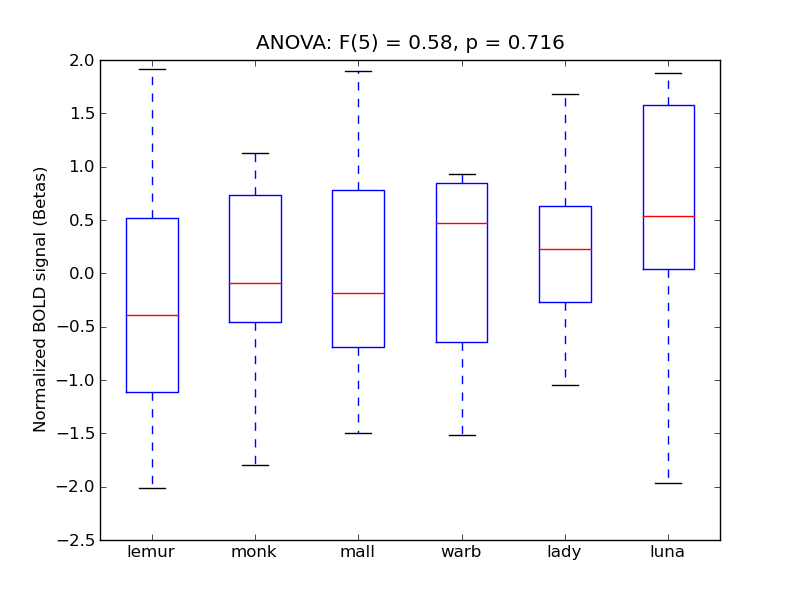
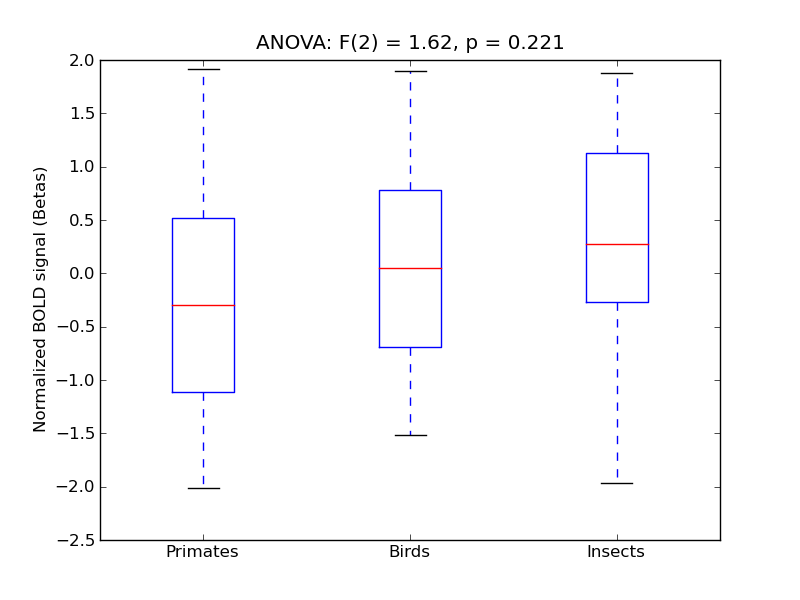
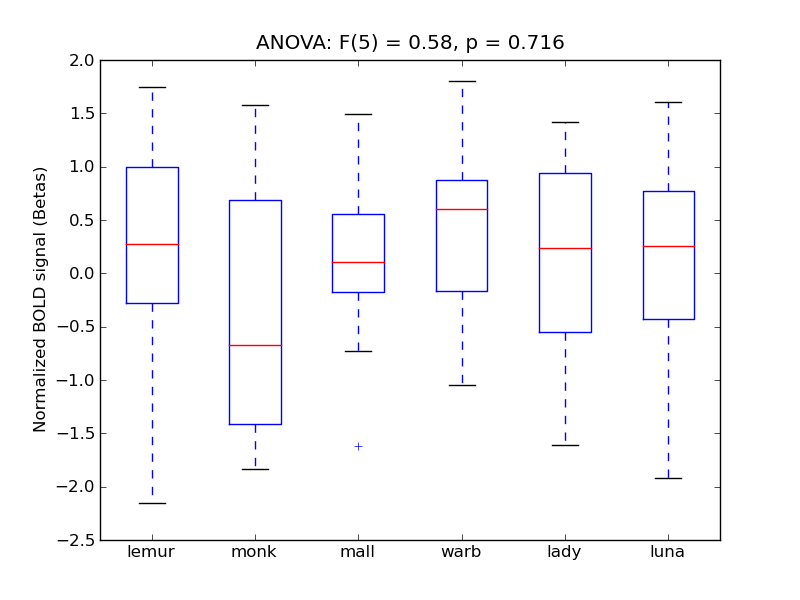
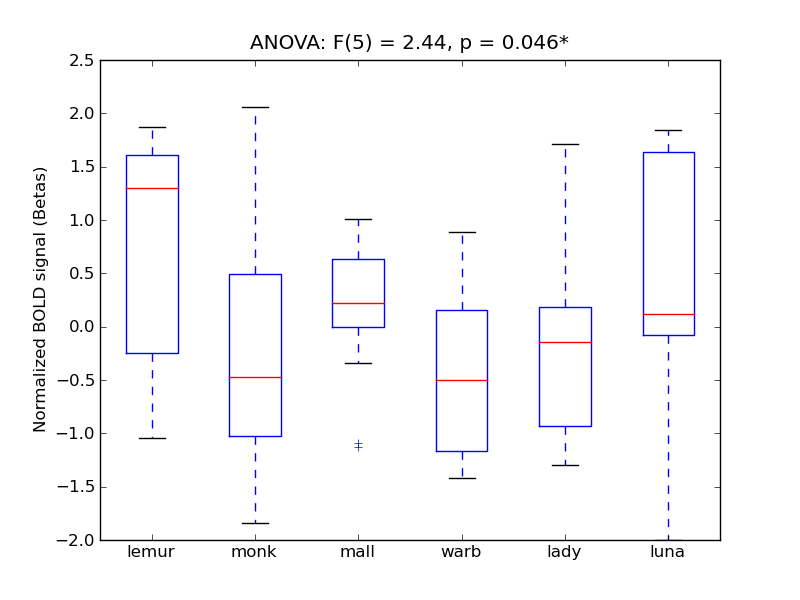
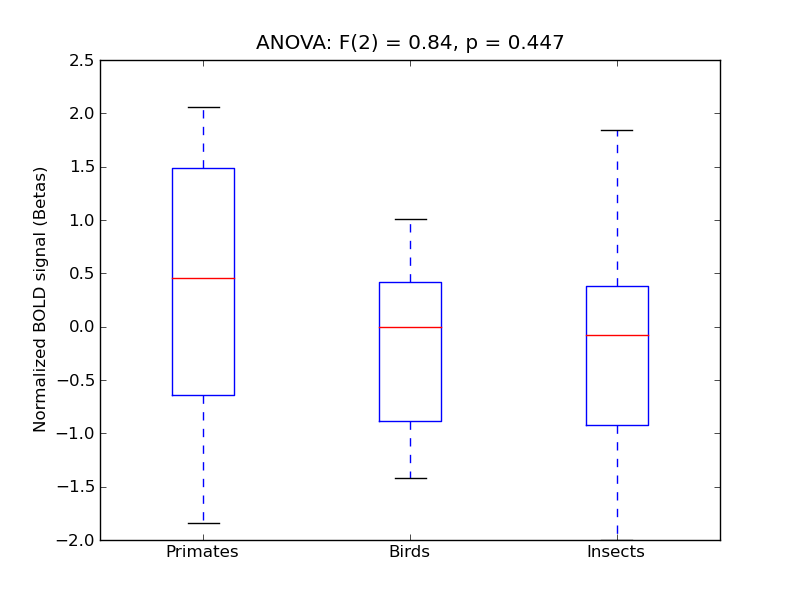
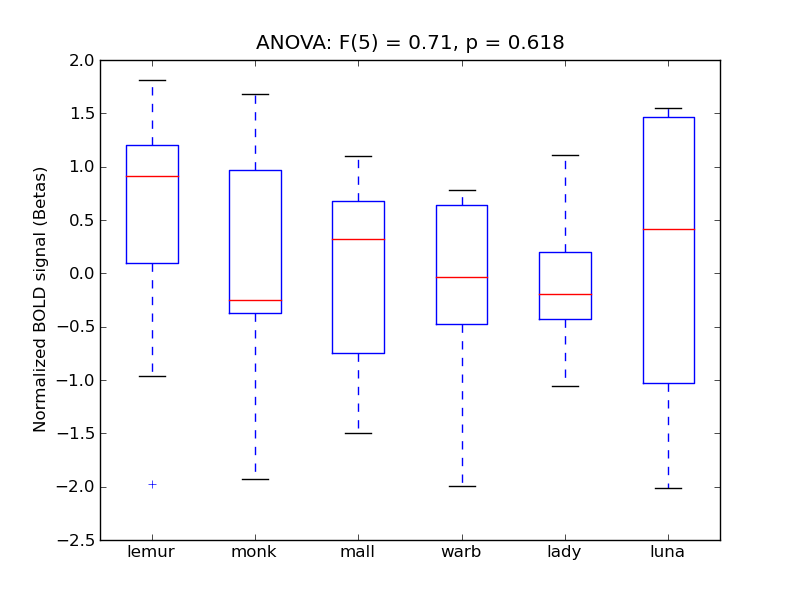
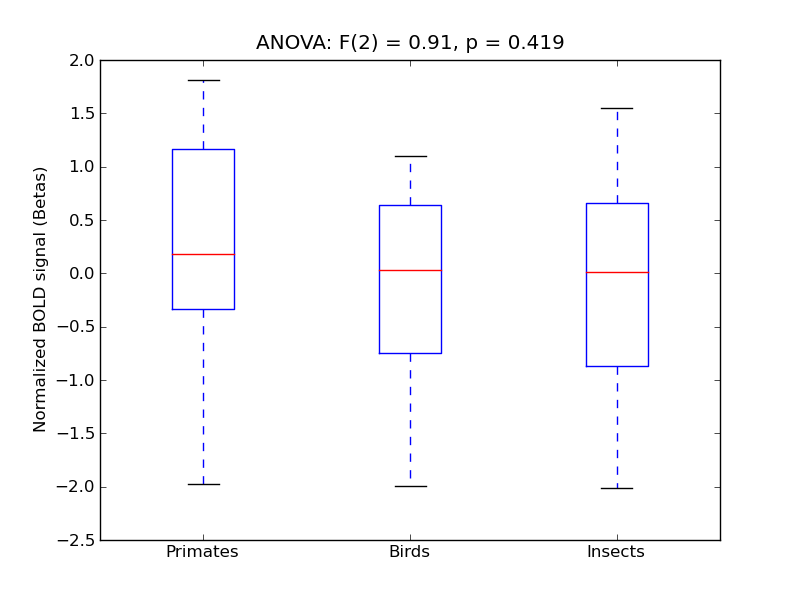
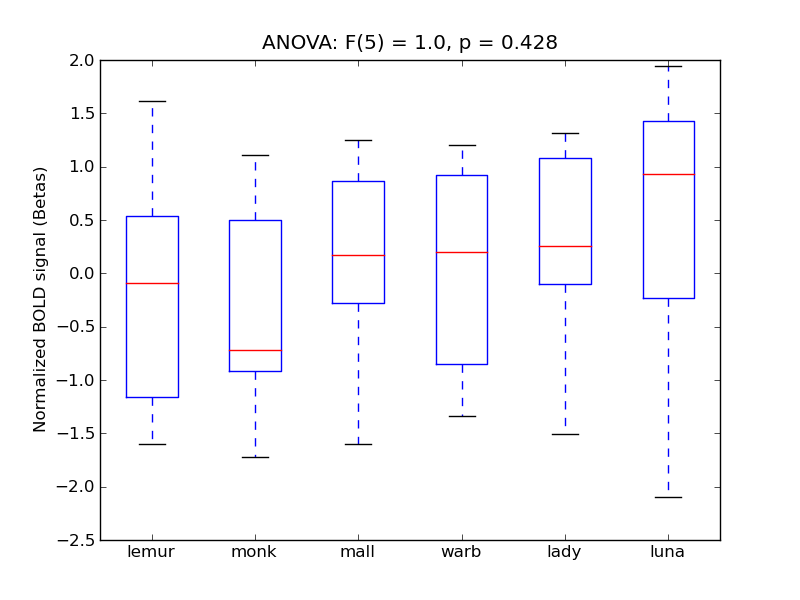
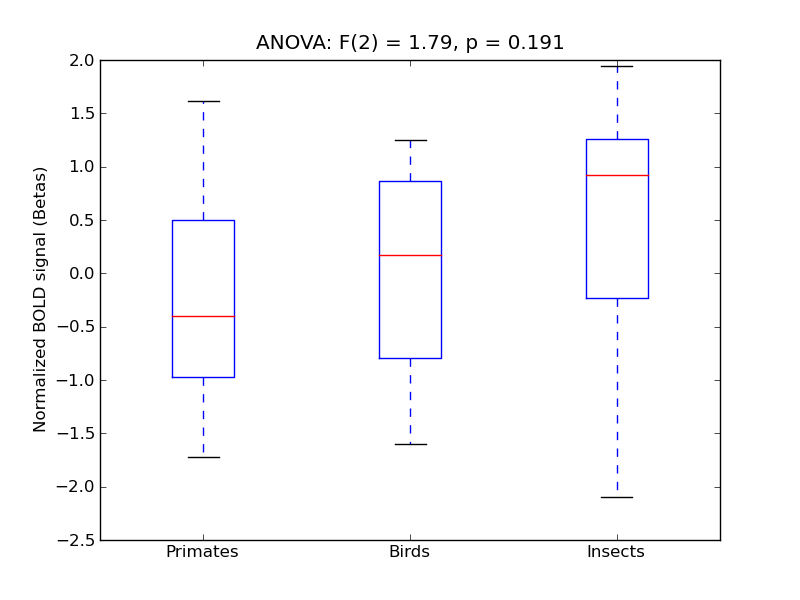
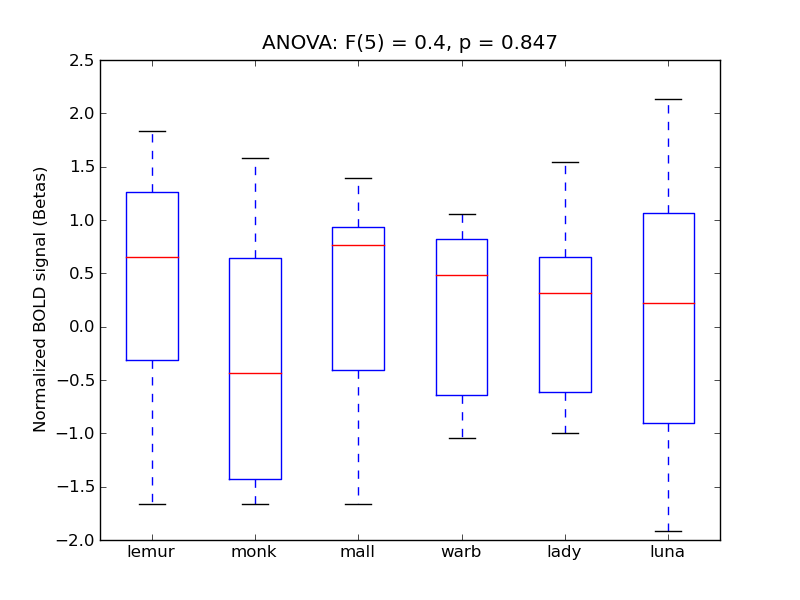
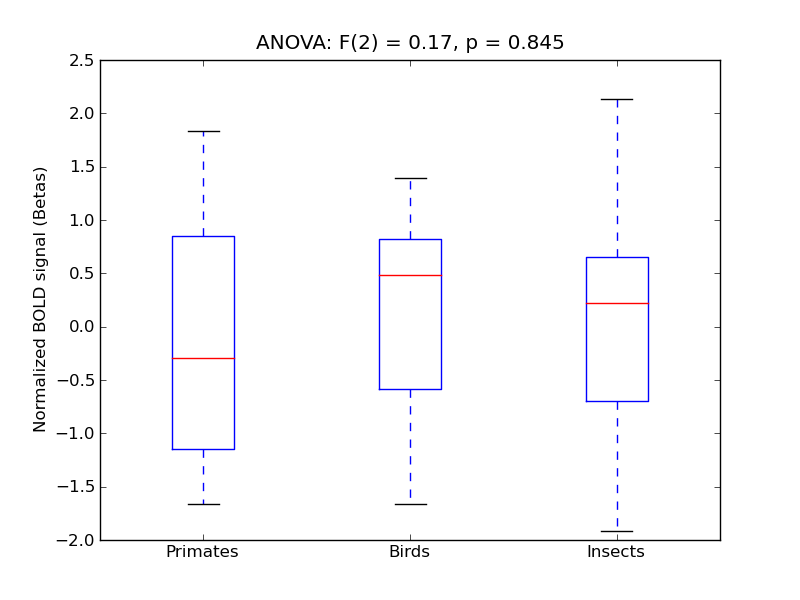
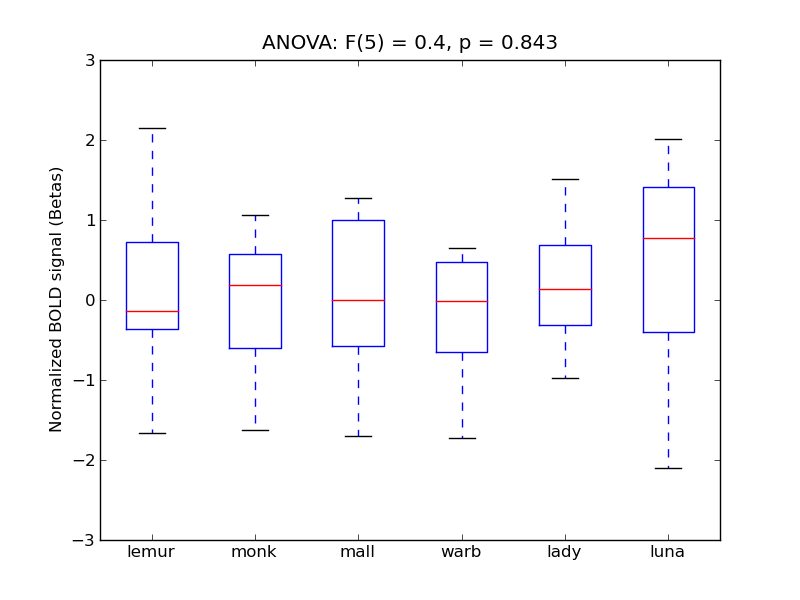
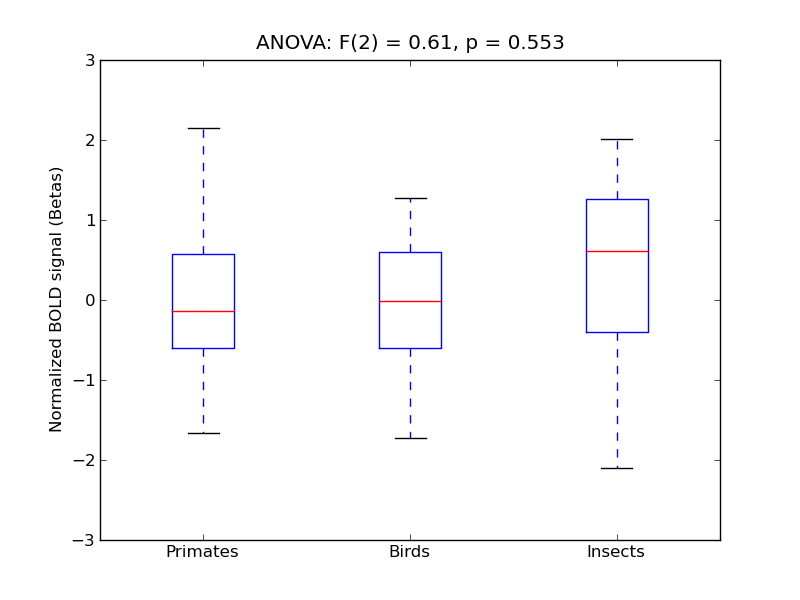
Inferior Temporal Gyrus, temporooccipital part
- <click back to table>
- Cross-Subject Similarity correlation: 0.67
- Correlation with behavioral similarity: 0.79
- Correlation with V1 model similarity: 0.24
- SVM Accuracy: 0.39
- Number of voxels in mask: mean = 166, stdev = 15
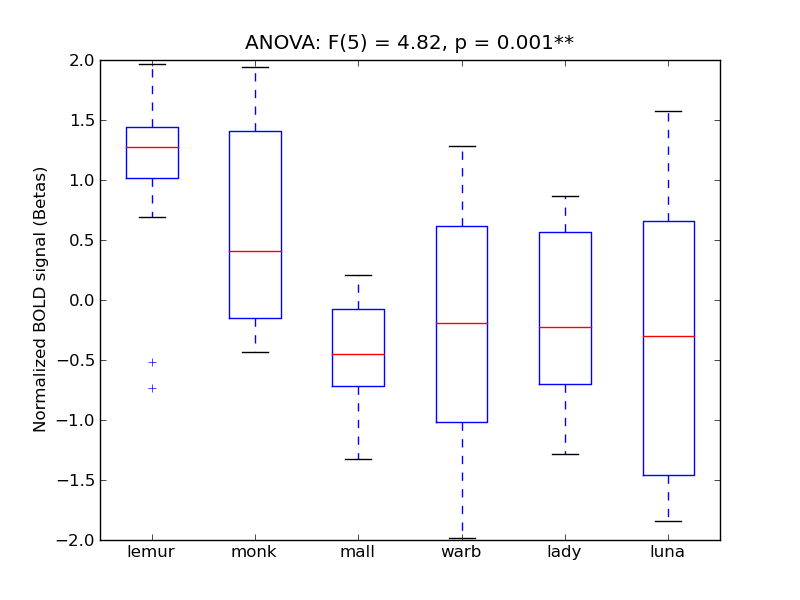
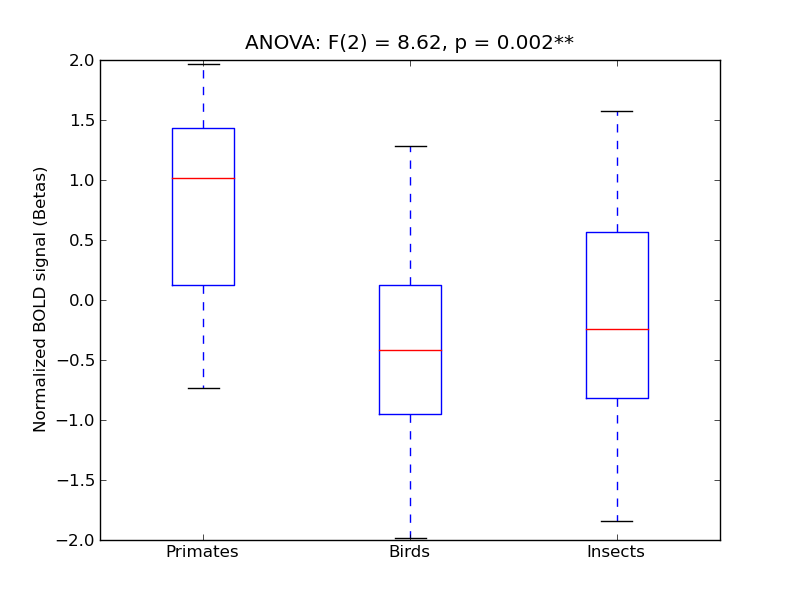
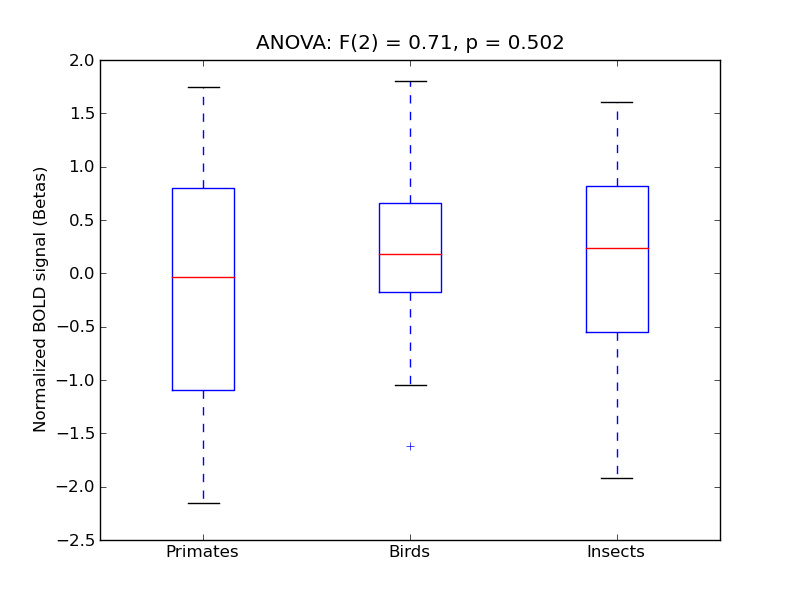
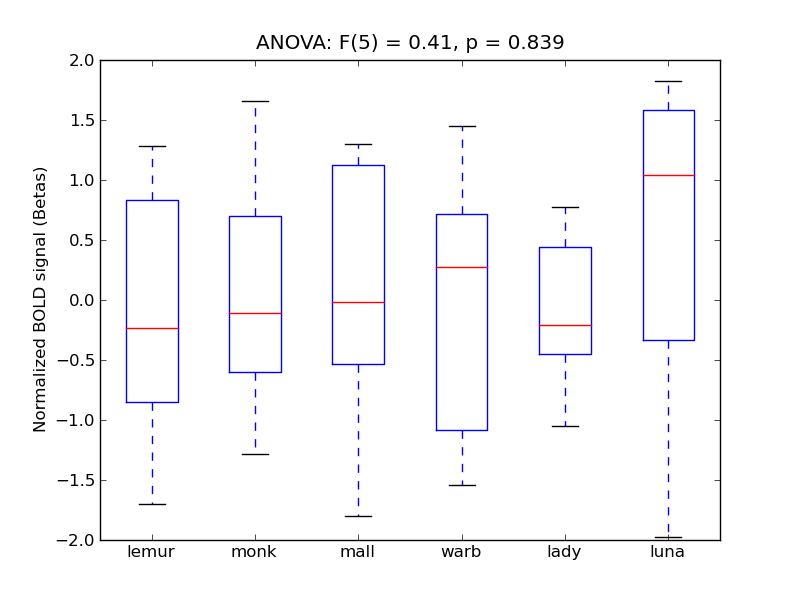
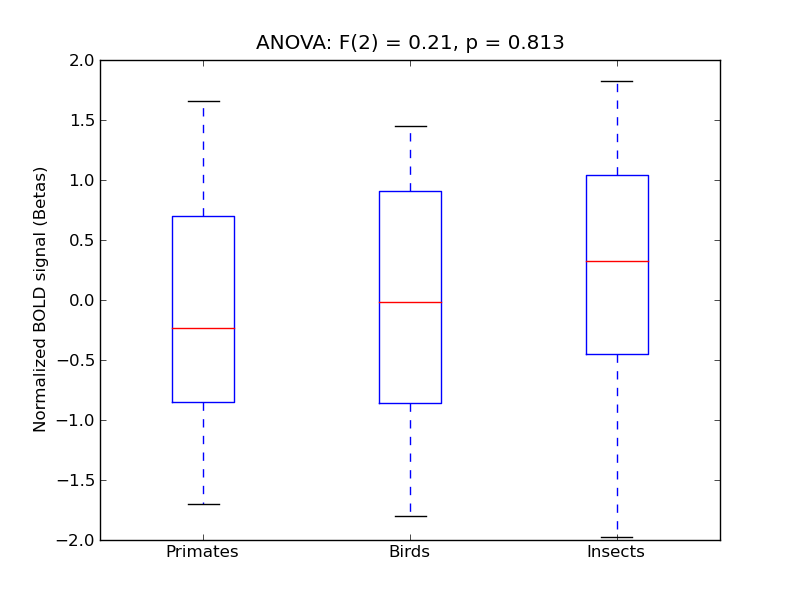
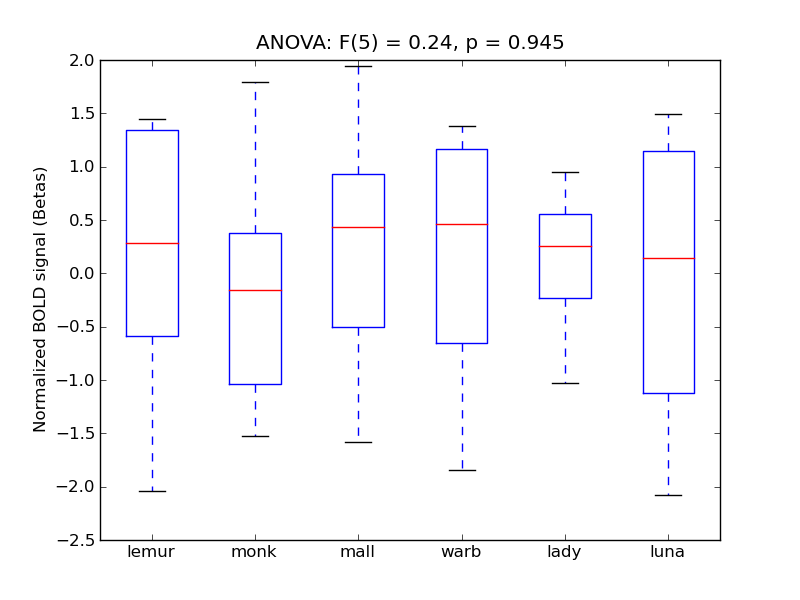
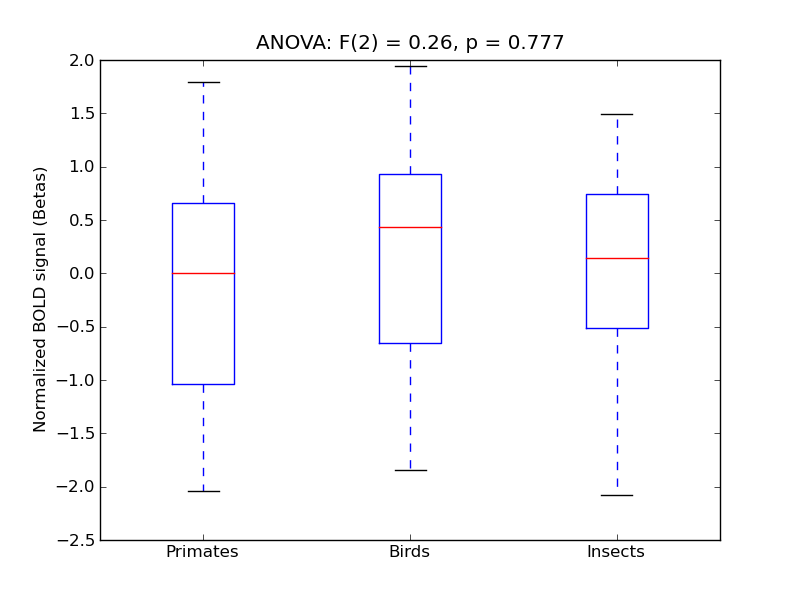
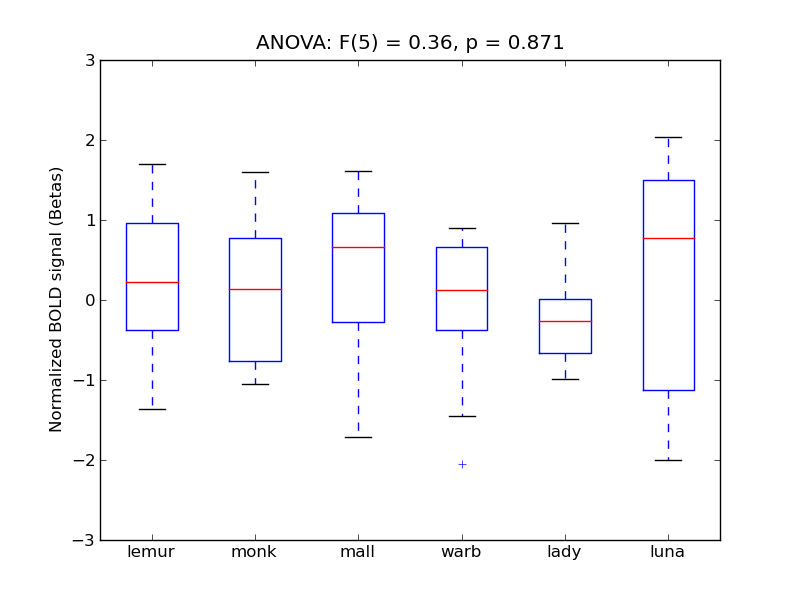
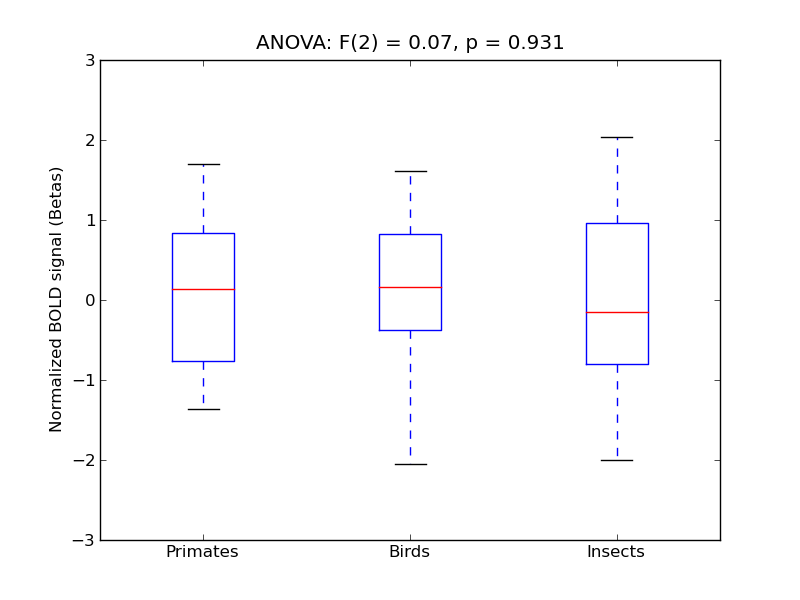
Middle Temporal Gyrus, temporooccipital part
- <click back to table>
- Cross-Subject Similarity correlation: 0.64
- Correlation with behavioral similarity: 0.8
- Correlation with V1 model similarity: 0.19
- SVM Accuracy: 0.41
- Number of voxels in mask: mean = 166, stdev = 15
Occipital Pole
- <click back to table>
- Cross-Subject Similarity correlation: 0.62
- Correlation with behavioral similarity: 0.14
- Correlation with V1 model similarity: 0.91
- SVM Accuracy: 0.68
- Number of voxels in mask: mean = 166, stdev = 15
Lateral Occipital Cortex, superior division
- <click back to table>
- Cross-Subject Similarity correlation: 0.6
- Correlation with behavioral similarity: 0.79
- Correlation with V1 model similarity: 0.16
- SVM Accuracy: 0.49
- Number of voxels in mask: mean = 166, stdev = 15
Lingual Gyrus
- <click back to table>
- Cross-Subject Similarity correlation: 0.49
- Correlation with behavioral similarity: 0.2
- Correlation with V1 model similarity: 0.47
- SVM Accuracy: 0.53
- Number of voxels in mask: mean = 166, stdev = 15
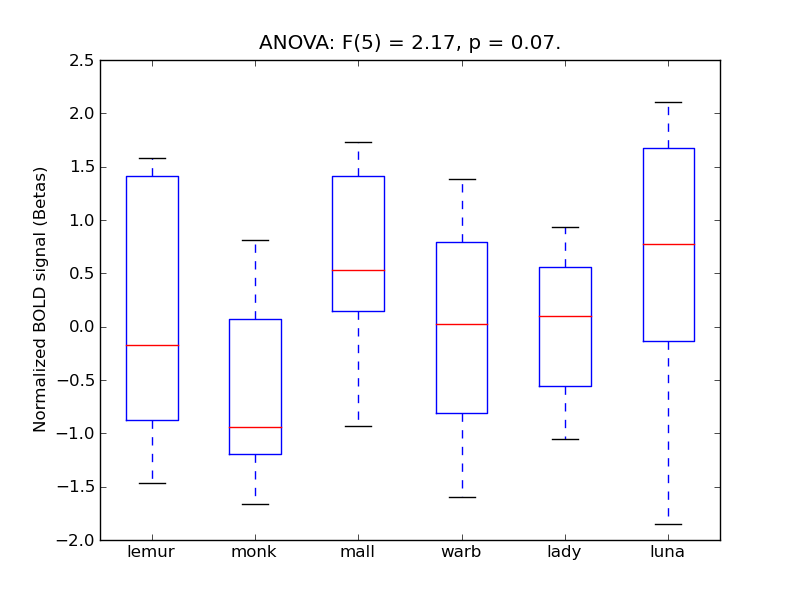
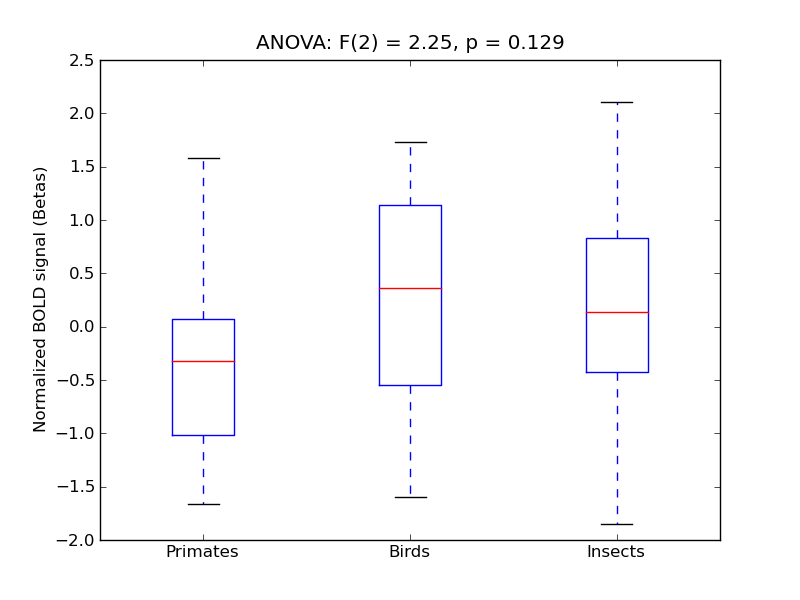
Temporal Fusiform Cortex, posterior division
- <click back to table>
- Cross-Subject Similarity correlation: 0.44
- Correlation with behavioral similarity: 0.87
- Correlation with V1 model similarity: 0.14
- SVM Accuracy: 0.36
- Number of voxels in mask: mean = 166, stdev = 15
Supramarginal Gyrus, posterior division
- <click back to table>
- Cross-Subject Similarity correlation: 0.37
- Correlation with behavioral similarity: 0.78
- Correlation with V1 model similarity: 0.26
- SVM Accuracy: 0.31
- Number of voxels in mask: mean = 166, stdev = 15
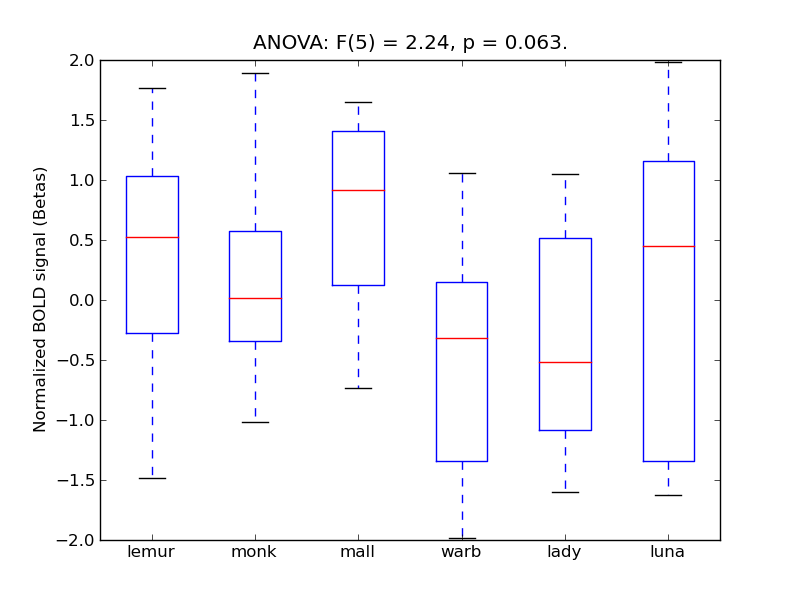
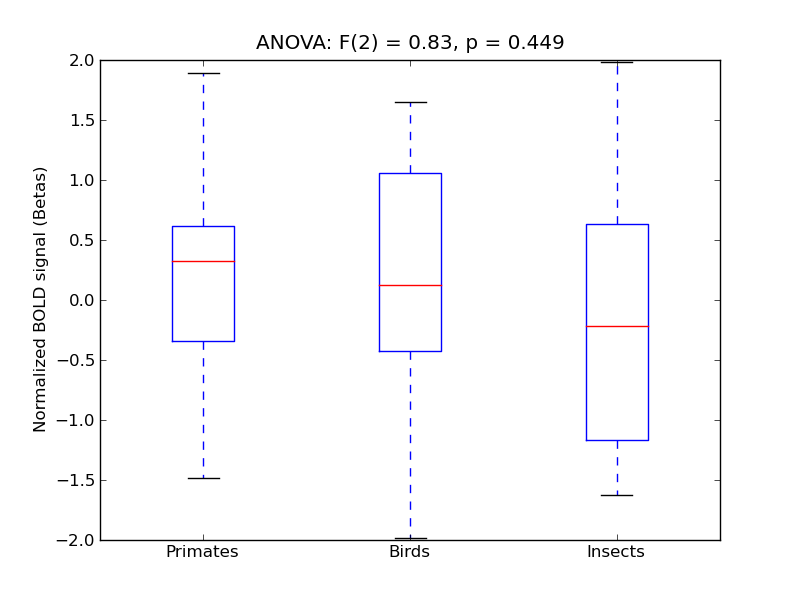
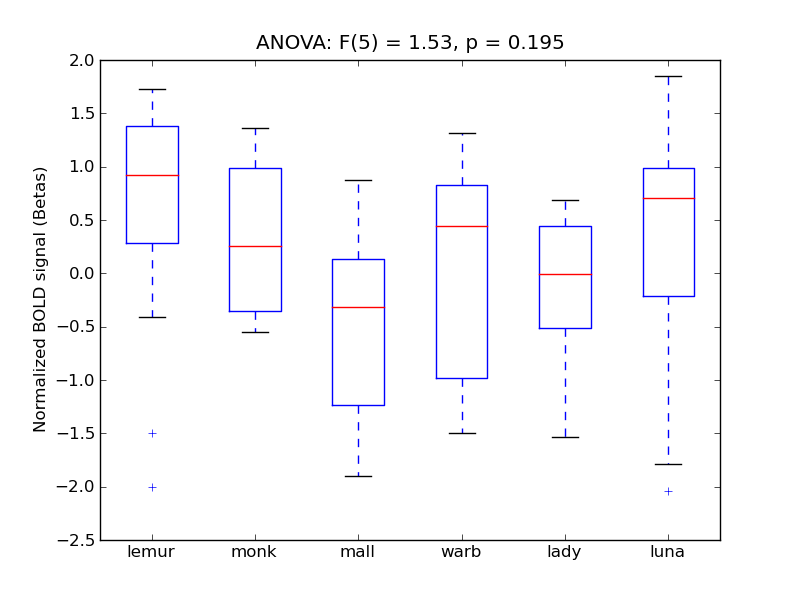
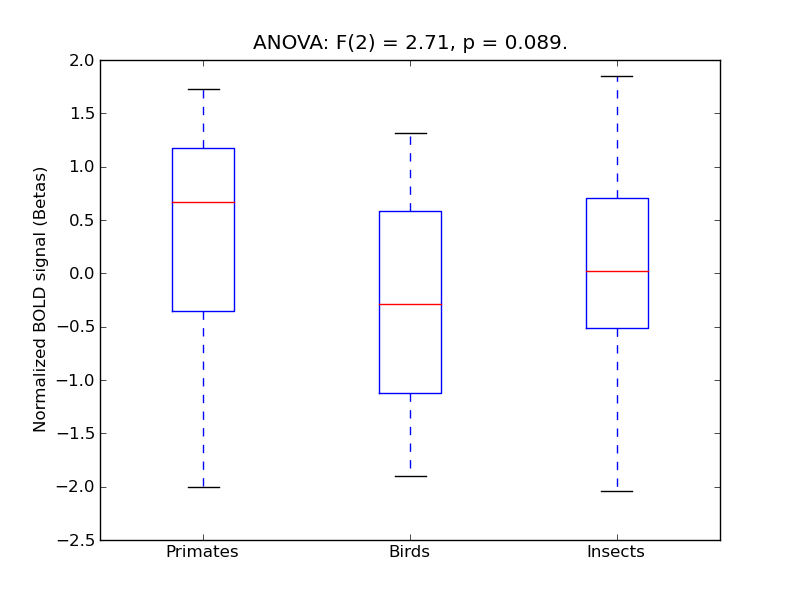
Inferior Frontal Gyrus, pars opercularis
- <click back to table>
- Cross-Subject Similarity correlation: 0.31
- Correlation with behavioral similarity: 0.64
- Correlation with V1 model similarity: -0.05
- SVM Accuracy: 0.29
- Number of voxels in mask: mean = 166, stdev = 15
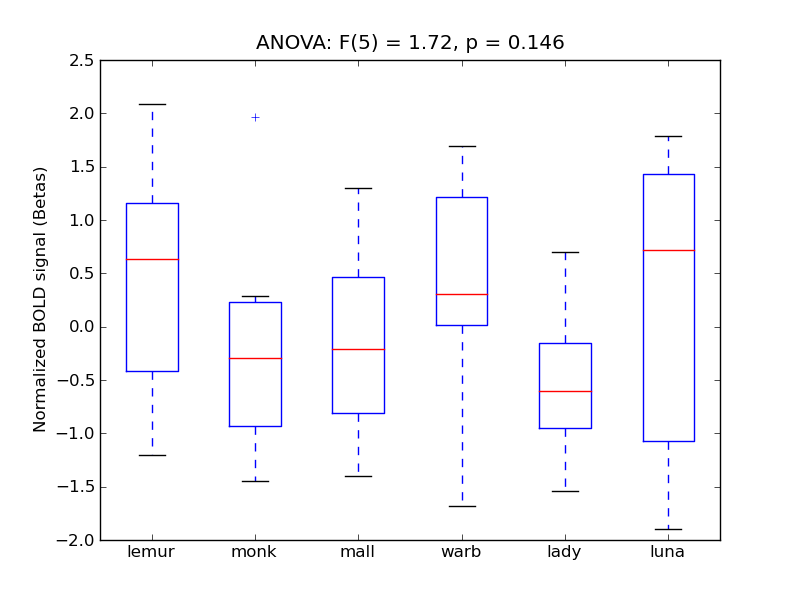
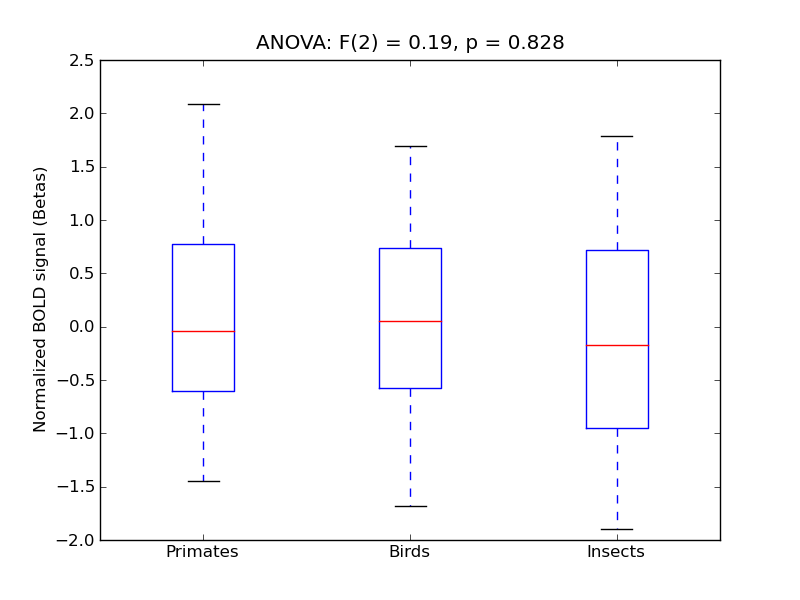
Superior Parietal Lobule
- <click back to table>
- Cross-Subject Similarity correlation: 0.31
- Correlation with behavioral similarity: 0.44
- Correlation with V1 model similarity: 0.2
- SVM Accuracy: 0.38
- Number of voxels in mask: mean = 166, stdev = 15
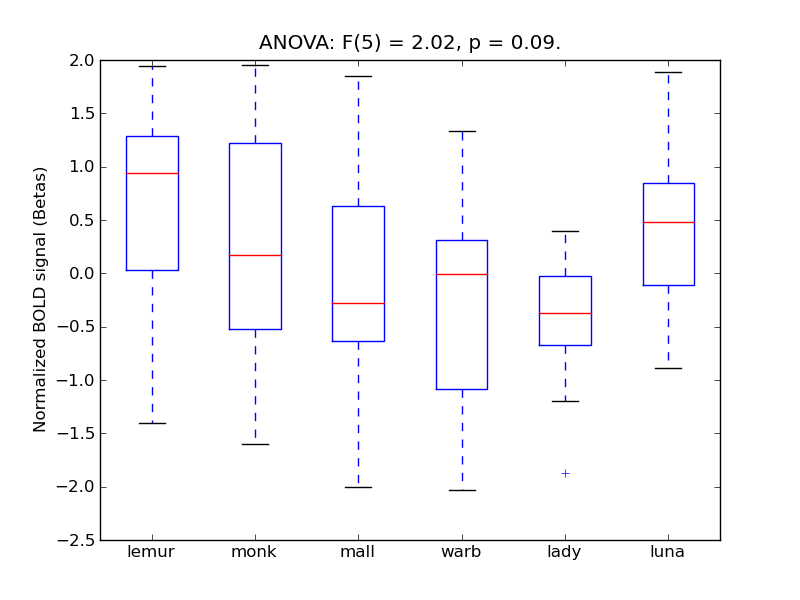
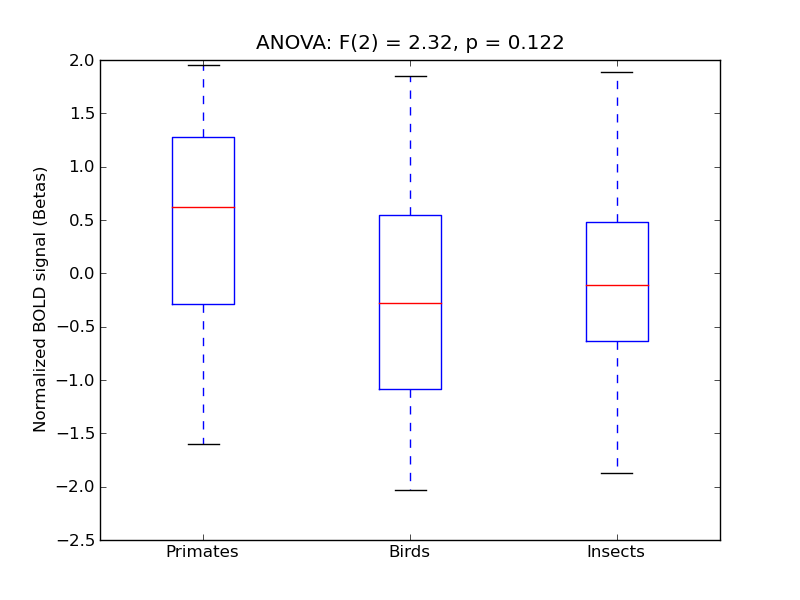
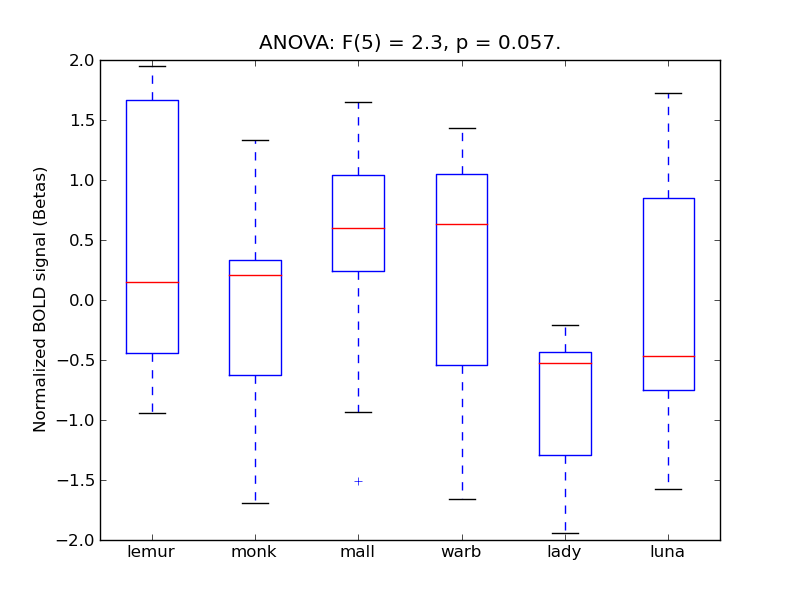
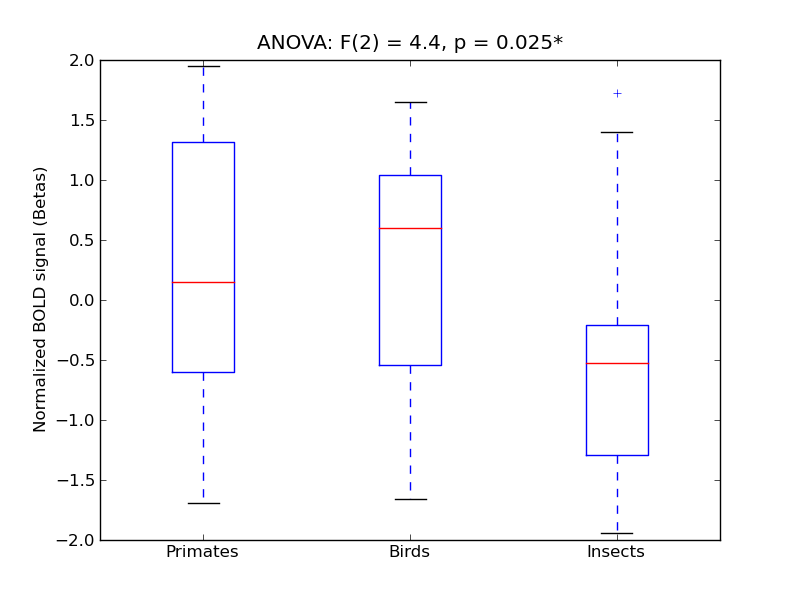
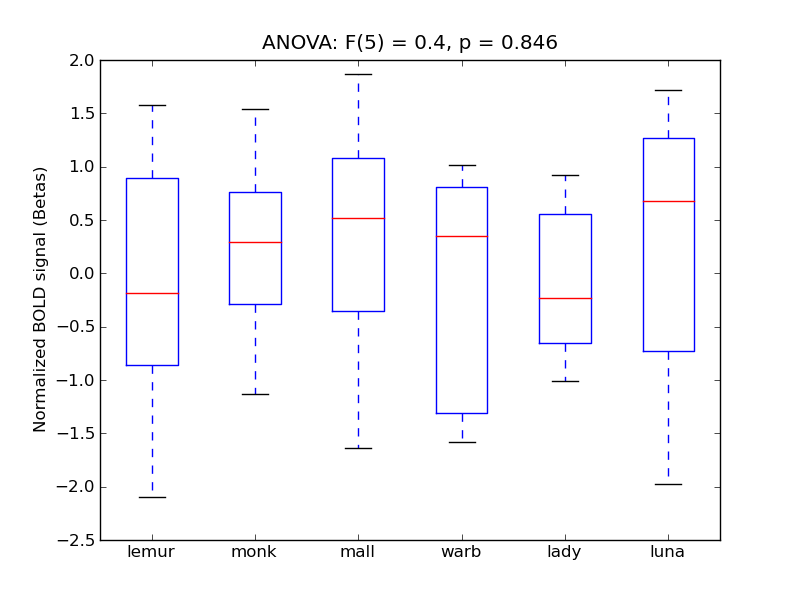
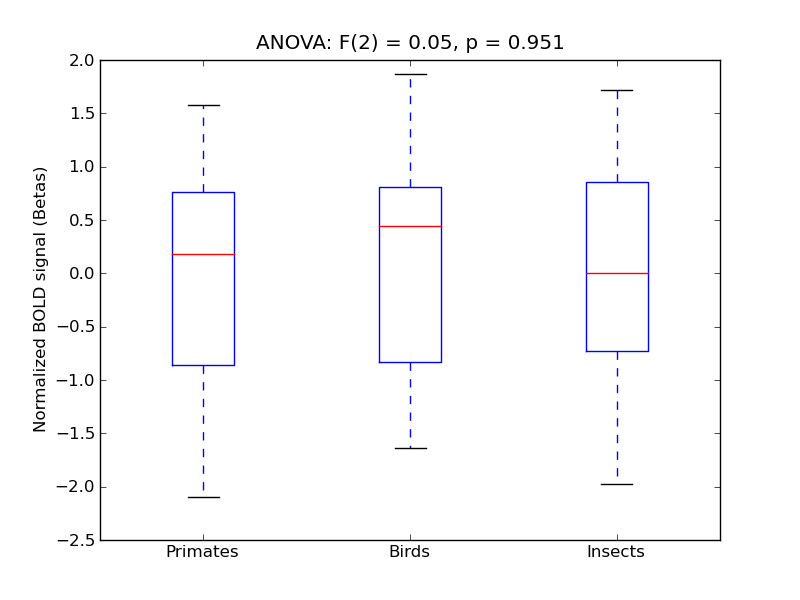
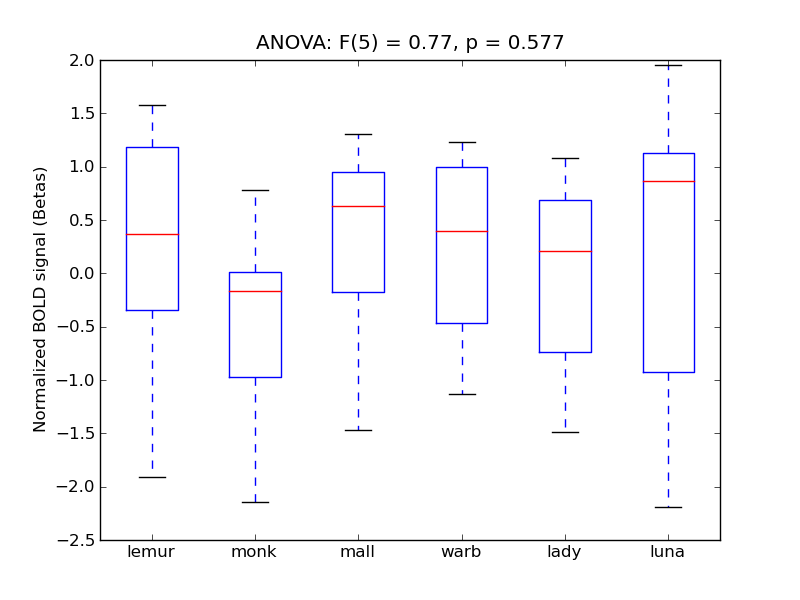
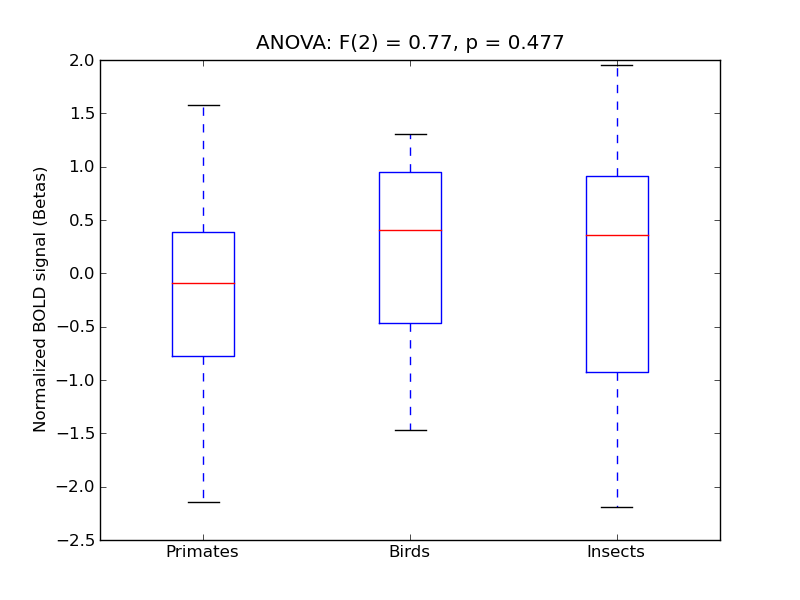
Inferior Temporal Gyrus, posterior division
- <click back to table>
- Cross-Subject Similarity correlation: 0.28
- Correlation with behavioral similarity: 0.72
- Correlation with V1 model similarity: 0.26
- SVM Accuracy: 0.22
- Number of voxels in mask: mean = 166, stdev = 15
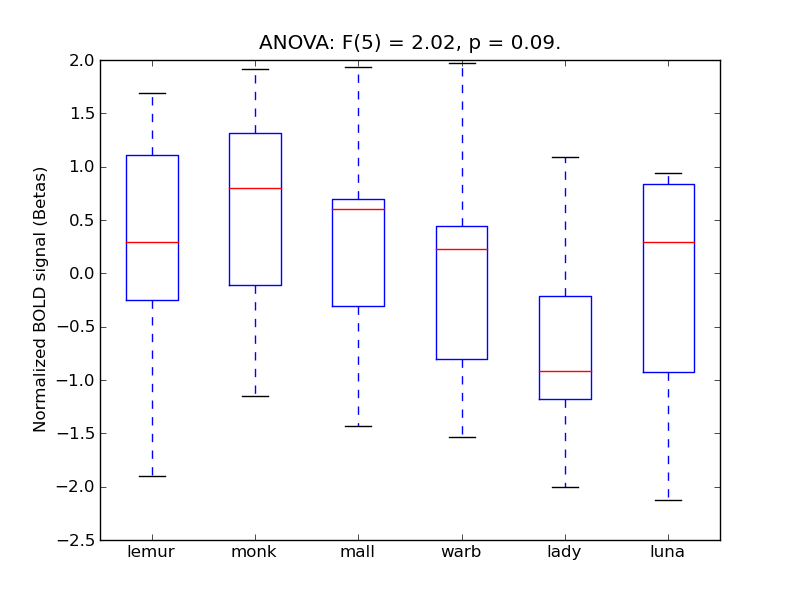
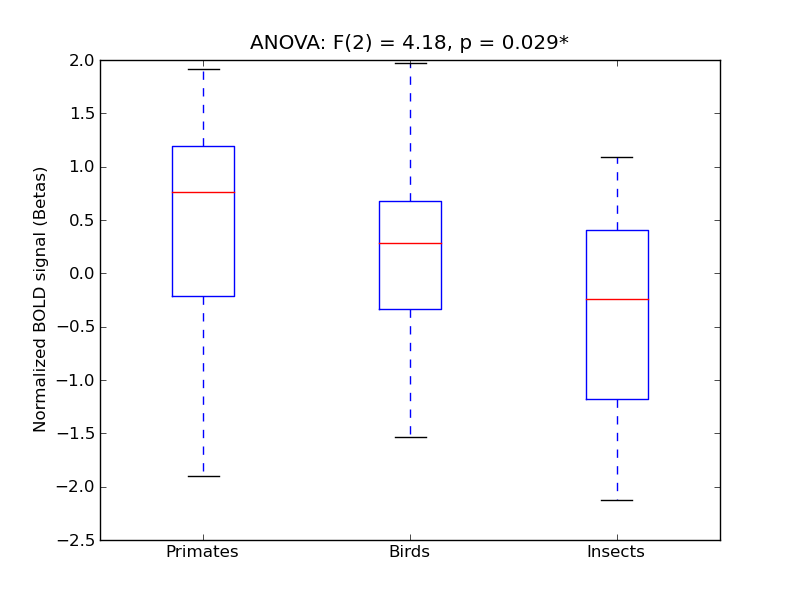
Intracalcarine Cortex
- <click back to table>
- Cross-Subject Similarity correlation: 0.28
- Correlation with behavioral similarity: 0.16
- Correlation with V1 model similarity: 0.56
- SVM Accuracy: 0.44
- Number of voxels in mask: mean = 166, stdev = 15
Inferior Frontal Gyrus, pars triangularis
- <click back to table>
- Cross-Subject Similarity correlation: 0.27
- Correlation with behavioral similarity: 0.65
- Correlation with V1 model similarity: 0.21
- SVM Accuracy: 0.25
- Number of voxels in mask: mean = 166, stdev = 15
Cuneal Cortex
- <click back to table>
- Cross-Subject Similarity correlation: 0.26
- Correlation with behavioral similarity: 0.68
- Correlation with V1 model similarity: 0.19
- SVM Accuracy: 0.35
- Number of voxels in mask: mean = 166, stdev = 15
Superior Temporal Gyrus, posterior division
- <click back to table>
- Cross-Subject Similarity correlation: 0.21
- Correlation with behavioral similarity: 0.51
- Correlation with V1 model similarity: 0.12
- SVM Accuracy: 0.22
- Number of voxels in mask: mean = 166, stdev = 15
Frontal Operculum Cortex
- <click back to table>
- Cross-Subject Similarity correlation: 0.21
- Correlation with behavioral similarity: 0.38
- Correlation with V1 model similarity: 0.07
- SVM Accuracy: 0.23
- Number of voxels in mask: mean = 166, stdev = 15
Supracalcarine Cortex
- <click back to table>
- Cross-Subject Similarity correlation: 0.2
- Correlation with behavioral similarity: 0.59
- Correlation with V1 model similarity: 0.32
- SVM Accuracy: 0.36
- Number of voxels in mask: mean = 166, stdev = 15
Parietal Operculum Cortex
- <click back to table>
- Cross-Subject Similarity correlation: 0.19
- Correlation with behavioral similarity: 0.73
- Correlation with V1 model similarity: 0.32
- SVM Accuracy: 0.26
- Number of voxels in mask: mean = 166, stdev = 15
Angular Gyrus
- <click back to table>
- Cross-Subject Similarity correlation: 0.18
- Correlation with behavioral similarity: 0.67
- Correlation with V1 model similarity: -0.01
- SVM Accuracy: 0.26
- Number of voxels in mask: mean = 166, stdev = 15
Planum Temporale
- <click back to table>
- Cross-Subject Similarity correlation: 0.17
- Correlation with behavioral similarity: 0.6
- Correlation with V1 model similarity: 0.15
- SVM Accuracy: 0.25
- Number of voxels in mask: mean = 166, stdev = 15
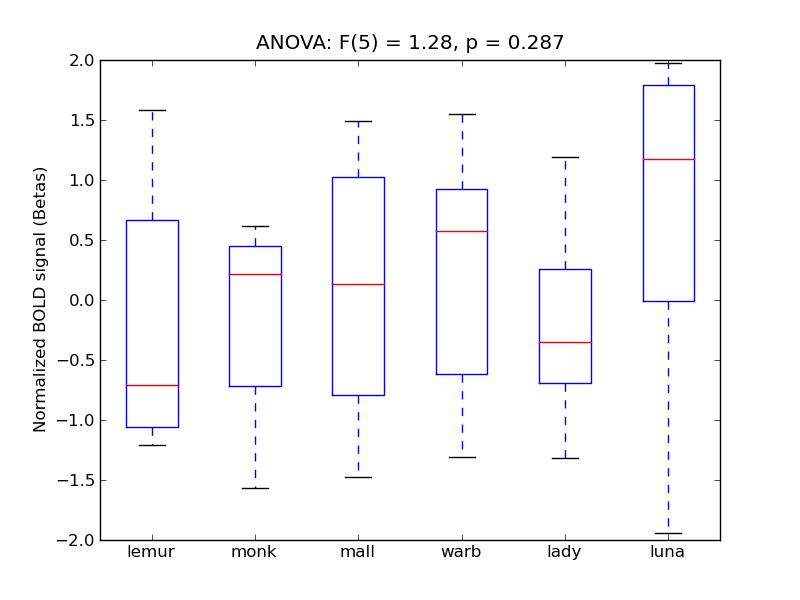
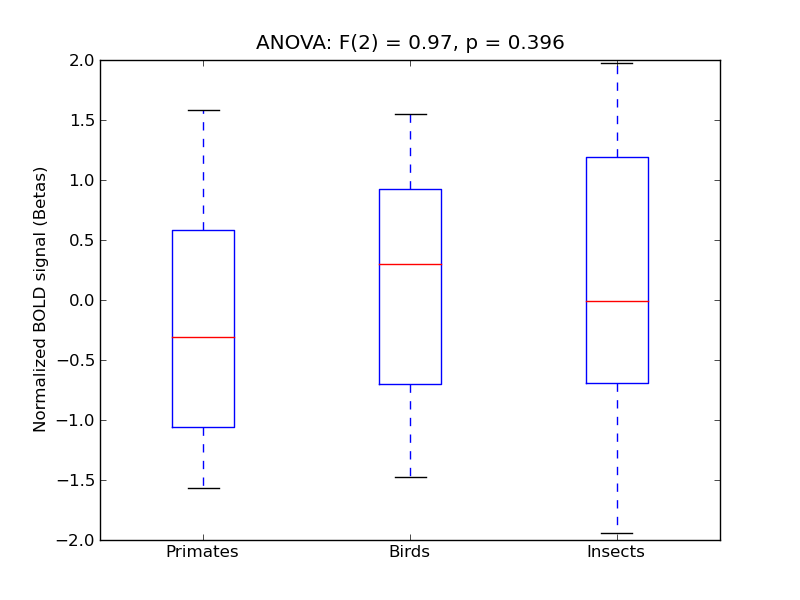
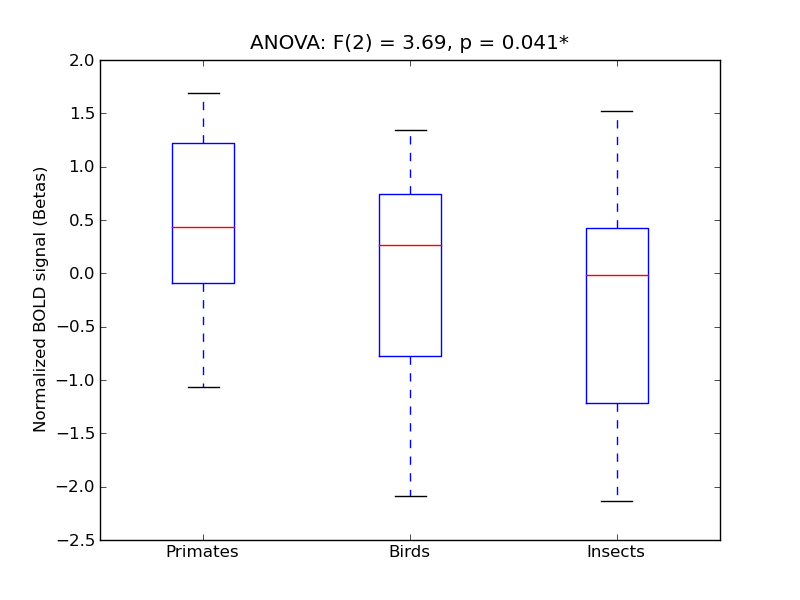
Temporal Pole
- <click back to table>
- Cross-Subject Similarity correlation: 0.16
- Correlation with behavioral similarity: 0.3
- Correlation with V1 model similarity: -0.13
- SVM Accuracy: 0.21
- Number of voxels in mask: mean = 166, stdev = 15
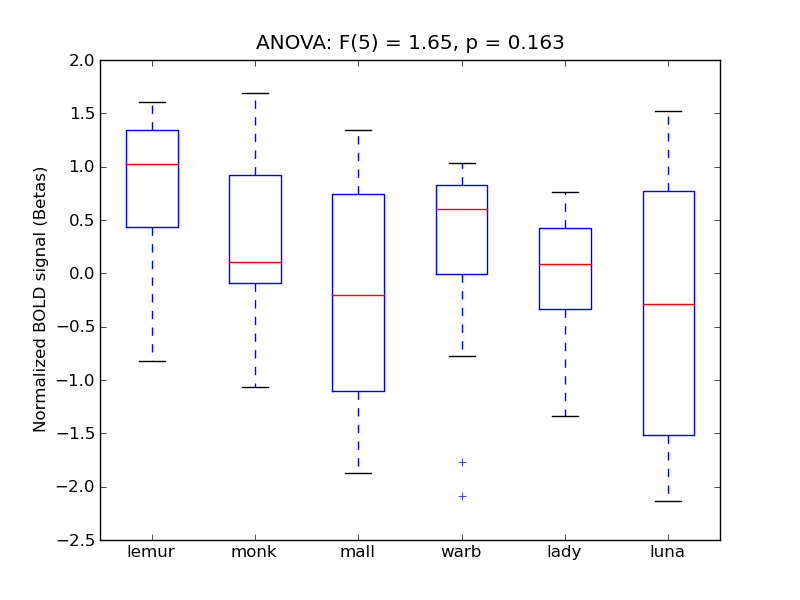
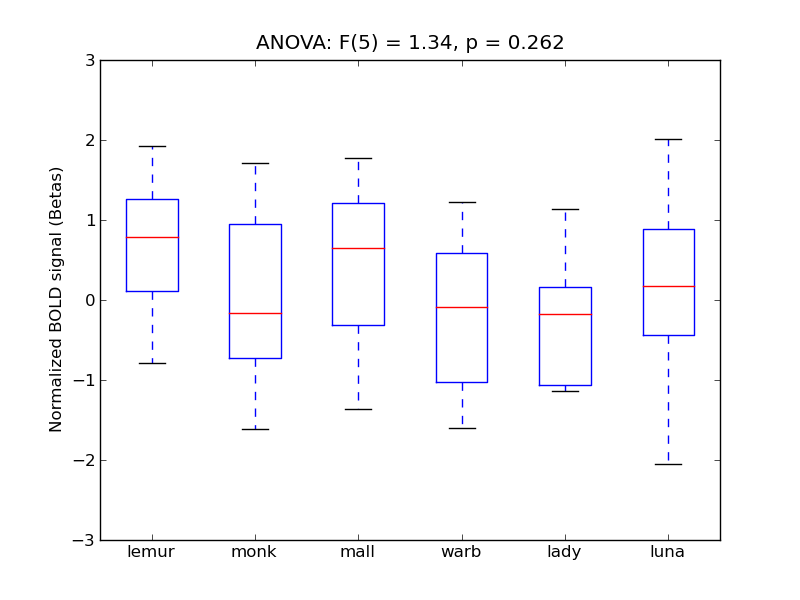
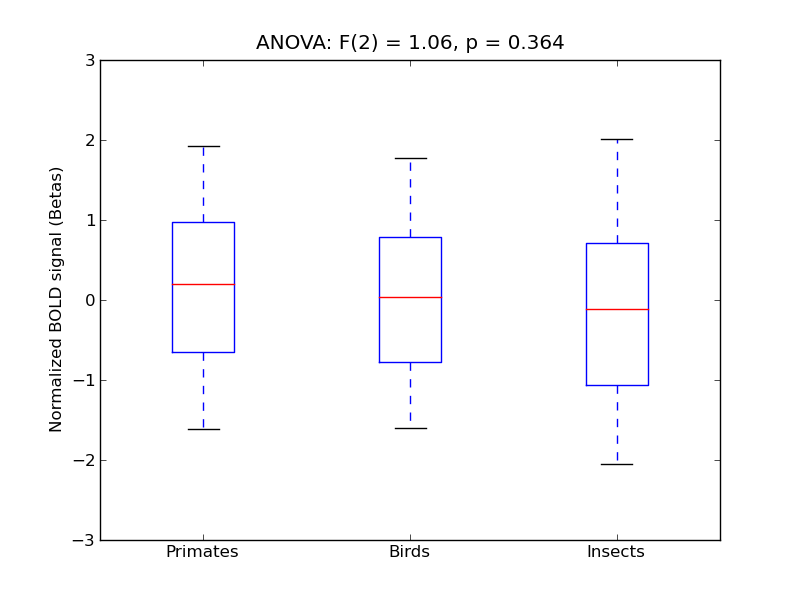
Frontal Orbital Cortex
- <click back to table>
- Cross-Subject Similarity correlation: 0.16
- Correlation with behavioral similarity: 0.1
- Correlation with V1 model similarity: 0.23
- SVM Accuracy: 0.21
- Number of voxels in mask: mean = 166, stdev = 15
Supramarginal Gyrus, anterior division
- <click back to table>
- Cross-Subject Similarity correlation: 0.16
- Correlation with behavioral similarity: 0.58
- Correlation with V1 model similarity: 0.04
- SVM Accuracy: 0.32
- Number of voxels in mask: mean = 166, stdev = 15
Middle Temporal Gyrus, posterior division
- <click back to table>
- Cross-Subject Similarity correlation: 0.14
- Correlation with behavioral similarity: 0.54
- Correlation with V1 model similarity: 0.24
- SVM Accuracy: 0.22
- Number of voxels in mask: mean = 166, stdev = 15
Precentral Gyrus
- <click back to table>
- Cross-Subject Similarity correlation: 0.14
- Correlation with behavioral similarity: 0.36
- Correlation with V1 model similarity: -0.04
- SVM Accuracy: 0.29
- Number of voxels in mask: mean = 166, stdev = 15
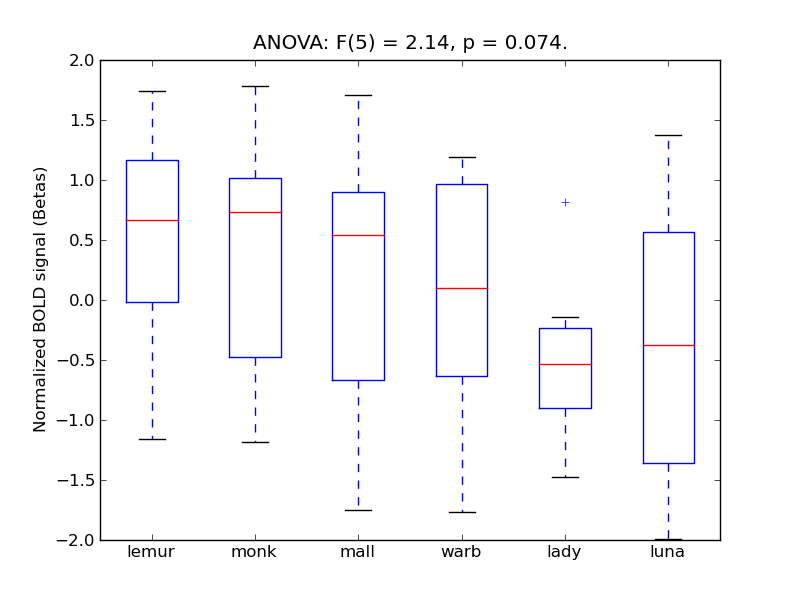
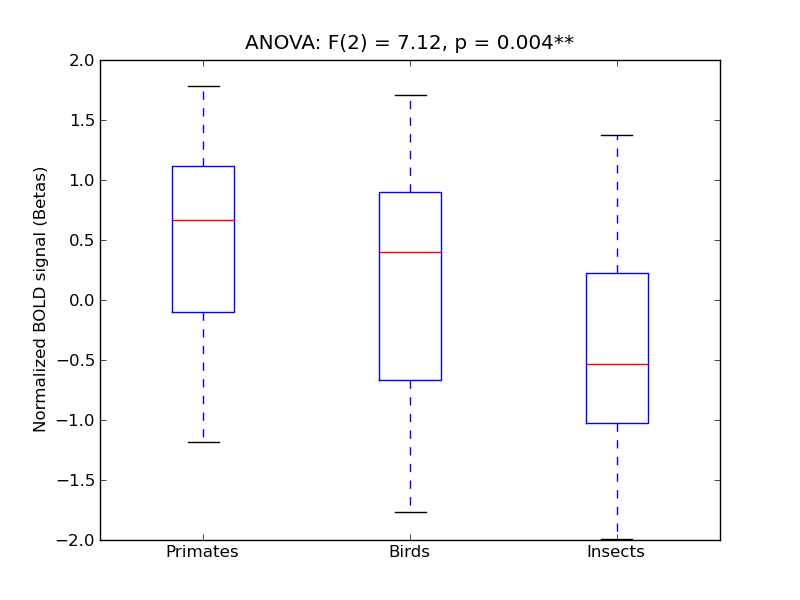
Precuneous Cortex
- <click back to table>
- Cross-Subject Similarity correlation: 0.1
- Correlation with behavioral similarity: 0.63
- Correlation with V1 model similarity: 0.1
- SVM Accuracy: 0.3
- Number of voxels in mask: mean = 166, stdev = 15
Superior Temporal Gyrus, anterior division
- <click back to table>
- Cross-Subject Similarity correlation: 0.09
- Correlation with behavioral similarity: 0.54
- Correlation with V1 model similarity: -0.02
- SVM Accuracy: 0.2
- Number of voxels in mask: mean = 166, stdev = 15
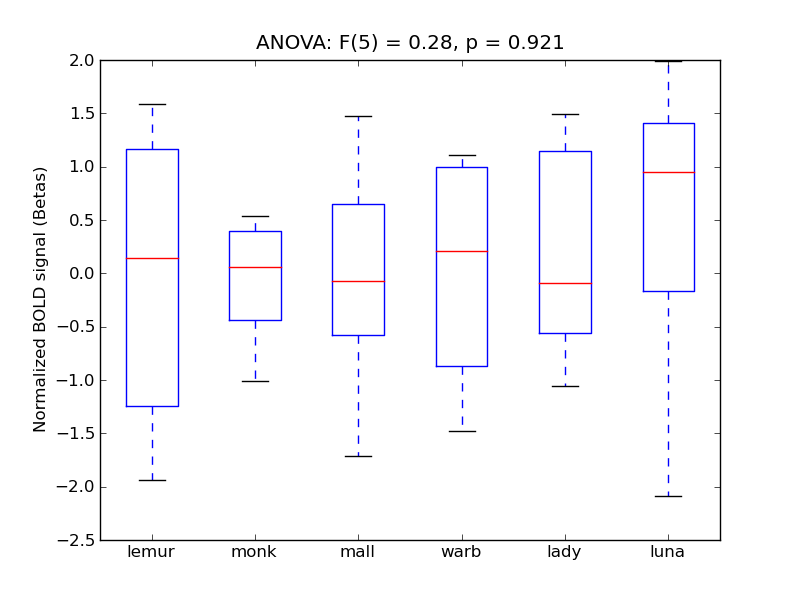
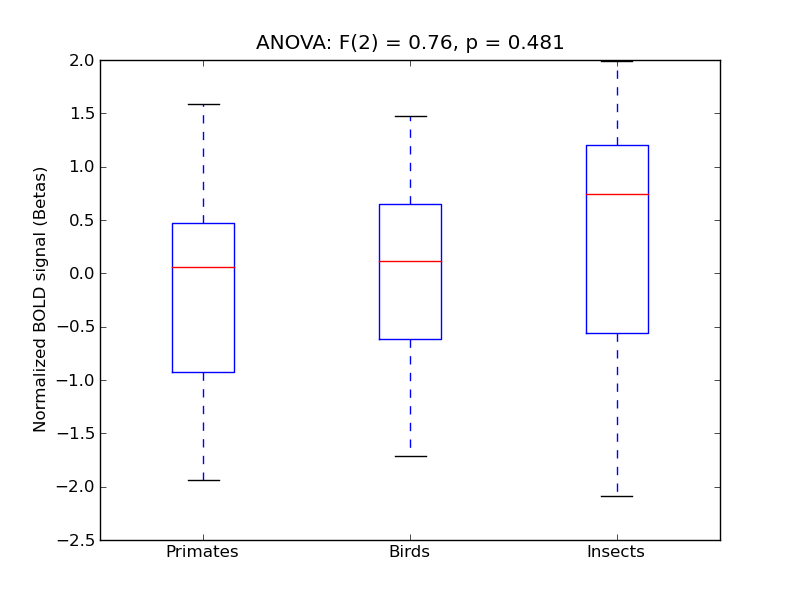
Middle Frontal Gyrus
- <click back to table>
- Cross-Subject Similarity correlation: 0.09
- Correlation with behavioral similarity: 0.47
- Correlation with V1 model similarity: -0.07
- SVM Accuracy: 0.25
- Number of voxels in mask: mean = 166, stdev = 15
Parahippocampal Gyrus, posterior division
- <click back to table>
- Cross-Subject Similarity correlation: 0.09
- Correlation with behavioral similarity: 0.14
- Correlation with V1 model similarity: 0.14
- SVM Accuracy: 0.2
- Number of voxels in mask: mean = 166, stdev = 15
Postcentral Gyrus
- <click back to table>
- Cross-Subject Similarity correlation: 0.08
- Correlation with behavioral similarity: 0.21
- Correlation with V1 model similarity: 0.22
- SVM Accuracy: 0.29
- Number of voxels in mask: mean = 166, stdev = 15
Frontal Pole
- <click back to table>
- Cross-Subject Similarity correlation: 0.08
- Correlation with behavioral similarity: 0.52
- Correlation with V1 model similarity: -0.04
- SVM Accuracy: 0.21
- Number of voxels in mask: mean = 166, stdev = 15
Superior Frontal Gyrus
- <click back to table>
- Cross-Subject Similarity correlation: 0.08
- Correlation with behavioral similarity: 0.55
- Correlation with V1 model similarity: -0.22
- SVM Accuracy: 0.2
- Number of voxels in mask: mean = 166, stdev = 15
Central Opercular Cortex
- <click back to table>
- Cross-Subject Similarity correlation: 0.07
- Correlation with behavioral similarity: 0.13
- Correlation with V1 model similarity: 0.34
- SVM Accuracy: 0.19
- Number of voxels in mask: mean = 166, stdev = 15
Cingulate Gyrus, posterior division
- <click back to table>
- Cross-Subject Similarity correlation: 0.06
- Correlation with behavioral similarity: 0.4
- Correlation with V1 model similarity: 0.32
- SVM Accuracy: 0.22
- Number of voxels in mask: mean = 166, stdev = 15
Subcallosal Cortex
- <click back to table>
- Cross-Subject Similarity correlation: 0.04
- Correlation with behavioral similarity: -0.06
- Correlation with V1 model similarity: 0.45
- SVM Accuracy: 0.17
- Number of voxels in mask: mean = 166, stdev = 15
Cingulate Gyrus, anterior division
- <click back to table>
- Cross-Subject Similarity correlation: 0.03
- Correlation with behavioral similarity: 0.07
- Correlation with V1 model similarity: 0.05
- SVM Accuracy: 0.18
- Number of voxels in mask: mean = 166, stdev = 15
Middle Temporal Gyrus, anterior division
- <click back to table>
- Cross-Subject Similarity correlation: 0.02
- Correlation with behavioral similarity: 0.47
- Correlation with V1 model similarity: 0.36
- SVM Accuracy: 0.21
- Number of voxels in mask: mean = 166, stdev = 15
Insular Cortex
- <click back to table>
- Cross-Subject Similarity correlation: 0.01
- Correlation with behavioral similarity: 0.42
- Correlation with V1 model similarity: -0.03
- SVM Accuracy: 0.22
- Number of voxels in mask: mean = 166, stdev = 15
Paracingulate Gyrus
- <click back to table>
- Cross-Subject Similarity correlation: 0.01
- Correlation with behavioral similarity: -0.12
- Correlation with V1 model similarity: 0.13
- SVM Accuracy: 0.18
- Number of voxels in mask: mean = 166, stdev = 15
Parahippocampal Gyrus, anterior division
- <click back to table>
- Cross-Subject Similarity correlation: 0.0
- Correlation with behavioral similarity: 0.3
- Correlation with V1 model similarity: 0.23
- SVM Accuracy: 0.21
- Number of voxels in mask: mean = 166, stdev = 15
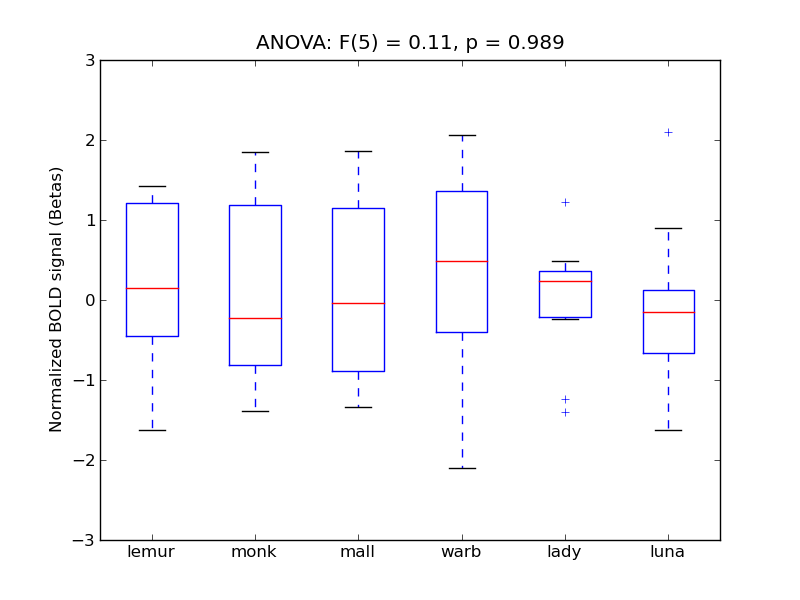
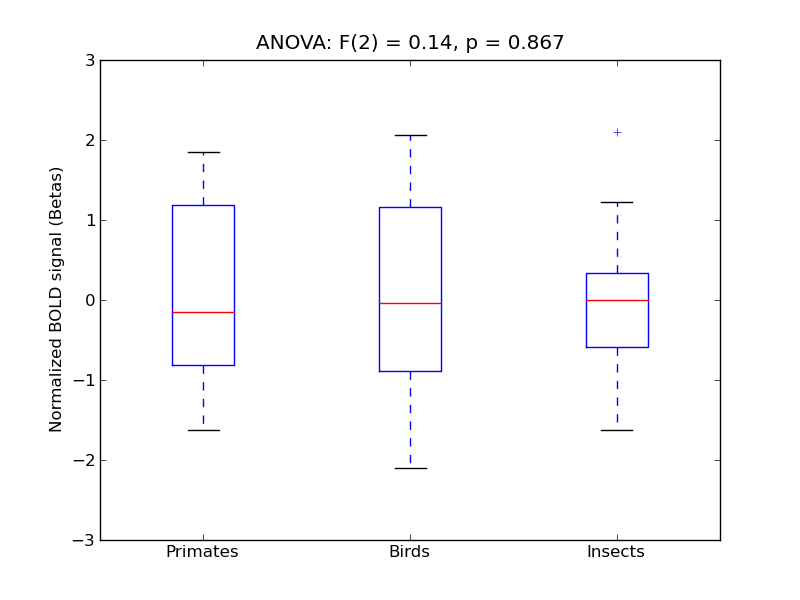
Inferior Temporal Gyrus, anterior division
- <click back to table>
- Cross-Subject Similarity correlation: -0.02
- Correlation with behavioral similarity: 0.19
- Correlation with V1 model similarity: -0.13
- SVM Accuracy: 0.21
- Number of voxels in mask: mean = 166, stdev = 15
Planum Polare
- <click back to table>
- Cross-Subject Similarity correlation: -0.02
- Correlation with behavioral similarity: 0.26
- Correlation with V1 model similarity: 0.03
- SVM Accuracy: 0.2
- Number of voxels in mask: mean = 166, stdev = 15
Heschl’s Gyrus (includes H1 and H2)
- <click back to table>
- Cross-Subject Similarity correlation: -0.06
- Correlation with behavioral similarity: 0.19
- Correlation with V1 model similarity: -0.04
- SVM Accuracy: 0.17
- Number of voxels in mask: mean = 166, stdev = 15