Table 2. Derived Masks Results
| Rois |
Similarity Correls |
Class |
6-level ANOVA |
3-level ANOVA |
Num Voxels |
|
|---|
| Mask |
XSs-R |
Beh-R |
V1-R |
SVM-ac |
F(5) |
alpha |
F(2) |
alpha |
mean |
stdev |
Plots |
|---|
| ITFu-P |
0.85 |
0.86 |
0.22 |
0.55 |
2.97 |
* |
4.99 |
* |
940 |
75 |
ITFu-P |
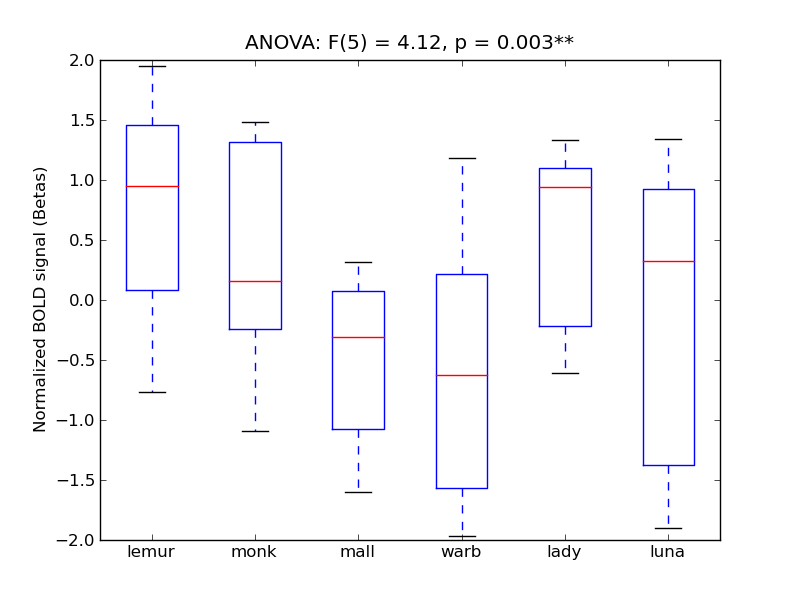
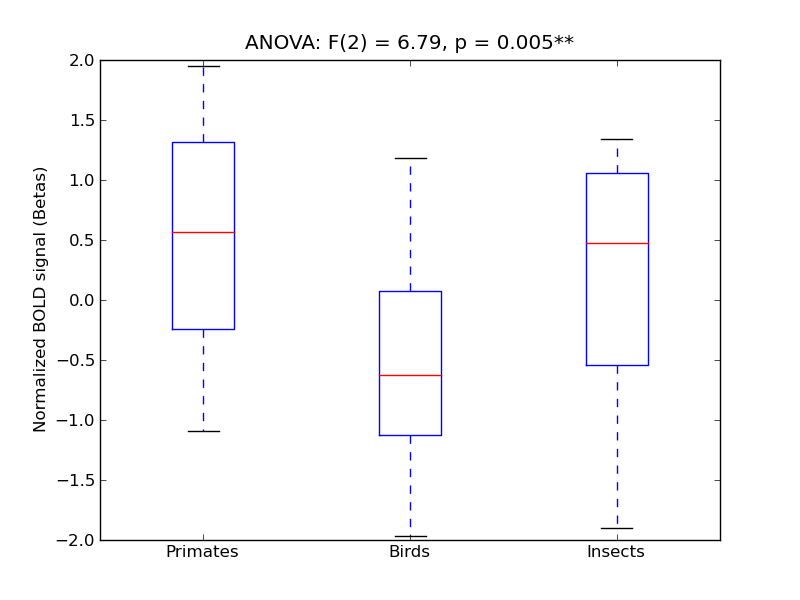
| Fus+ |
0.8 |
0.91 |
0.19 |
0.63 |
4.12 |
** |
6.79 |
** |
1697 |
156 |
Fus |
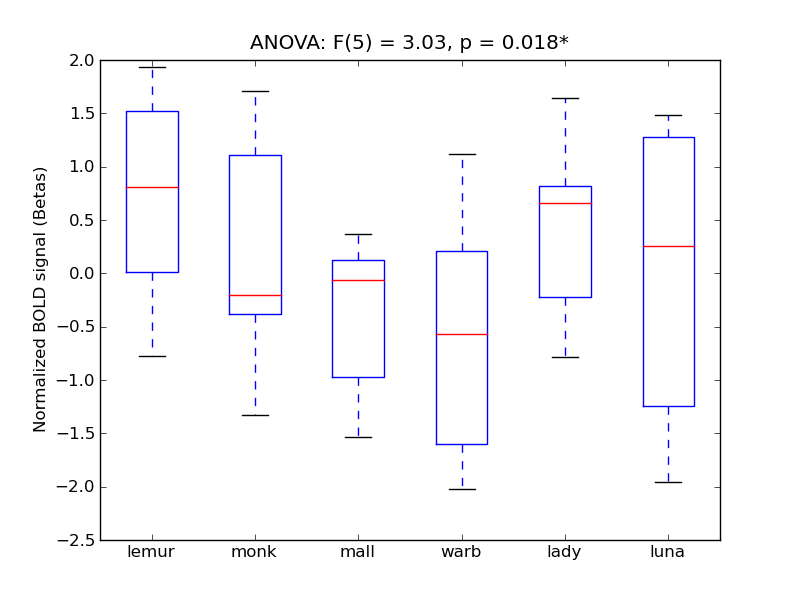
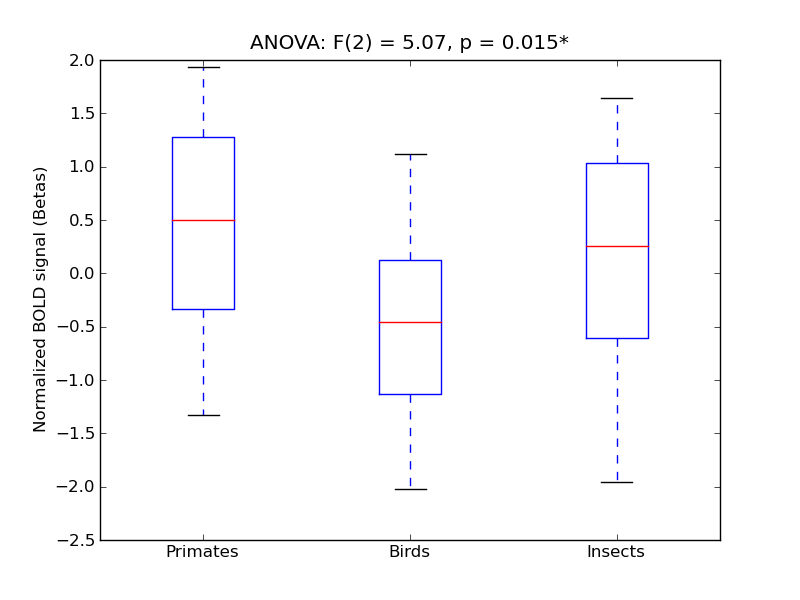
| VOcT+ |
0.8 |
0.9 |
0.2 |
0.6 |
3.03 |
* |
5.07 |
* |
2882 |
213 |
VOcT |
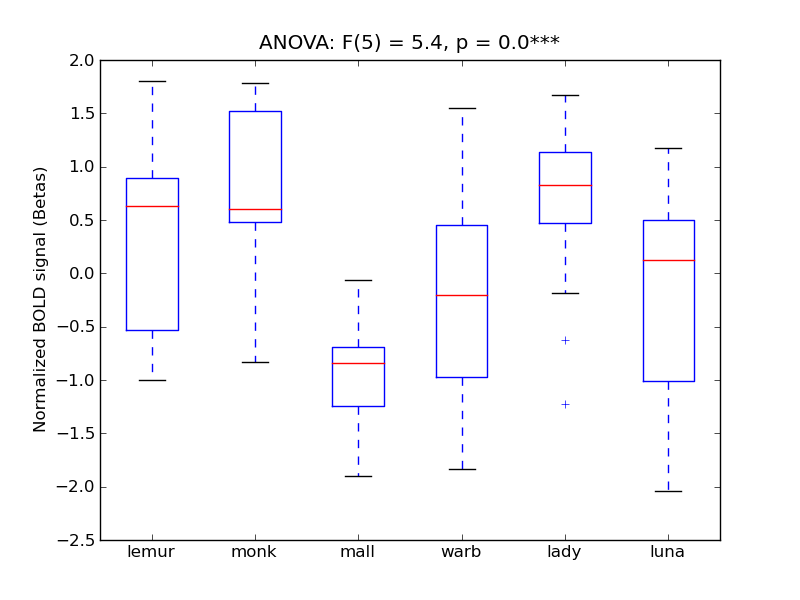
| Ling-P |
0.64 |
0.2 |
0.53 |
0.57 |
5.4 |
*** |
11.06 |
*** |
527 |
42 |
Ling-P |
| ITG+ |
0.51 |
0.71 |
0.31 |
0.36 |
2.03 |
<* |
0.75 |
|
1185 |
68 |
ITG |
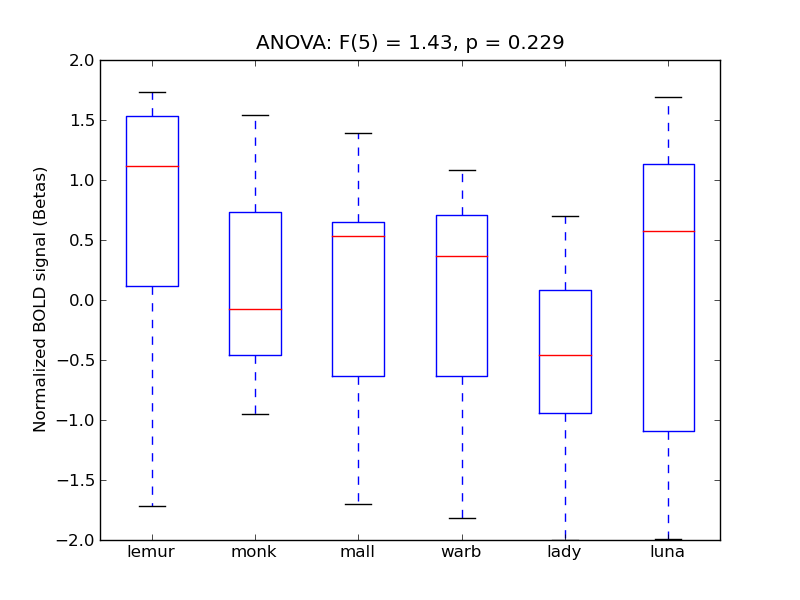
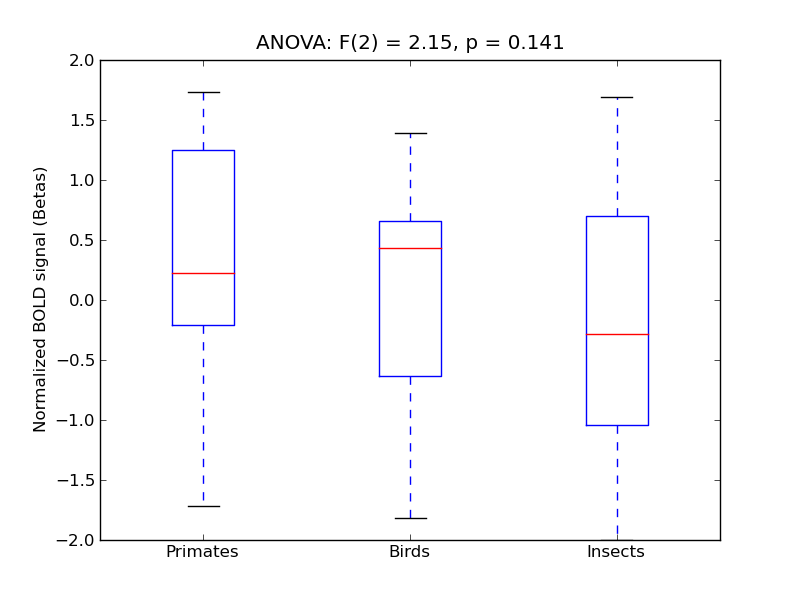
| ITFu-A |
0.43 |
0.84 |
0.15 |
0.3 |
1.43 |
|
2.15 |
|
1277 |
81 |
ITFu-A |
| Ling-A |
0.0 |
0.39 |
0.22 |
0.26 |
2.61 |
* |
3.4 |
<* |
560 |
33 |
Ling-A |
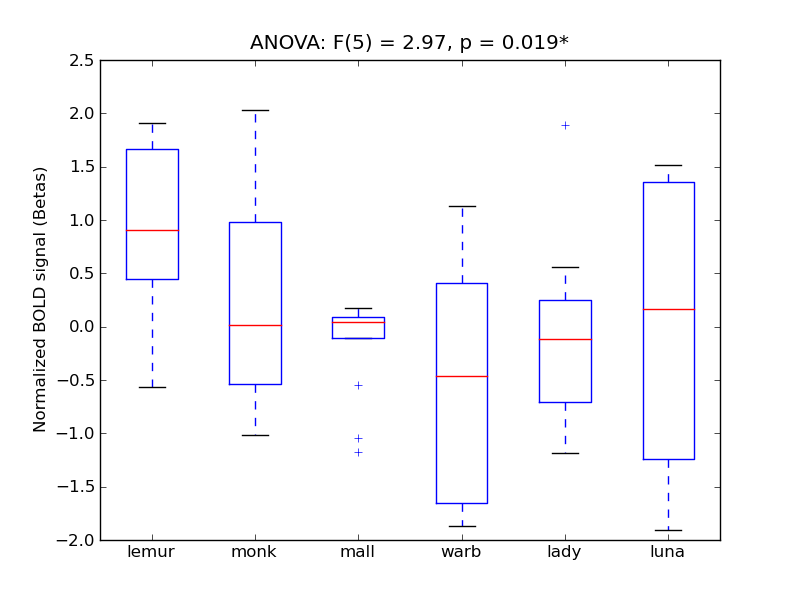
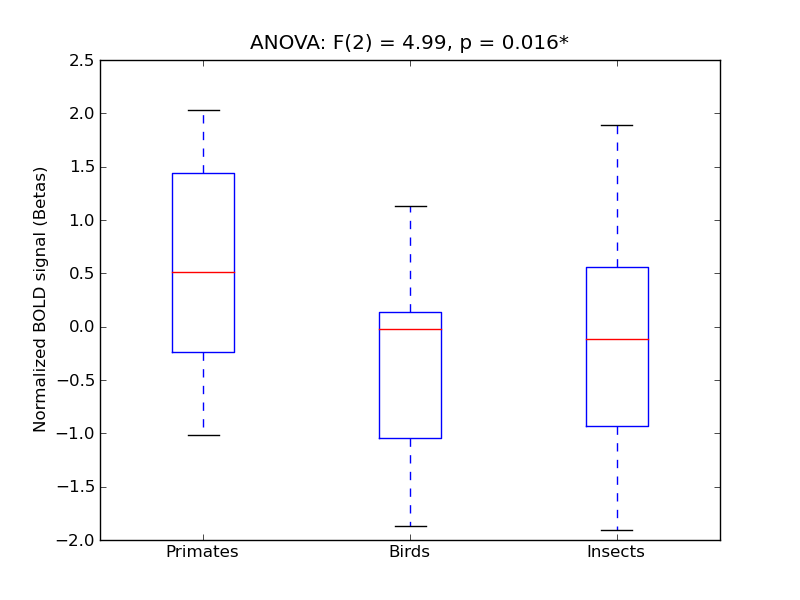
OcFus, TOFus, and TFus-P
- <click back to table>
- Cross-Subject Similarity correlation: 0.8
- Correlation with behavioral similarity: 0.91
- Correlation with V1 model similarity: 0.19
- SVM Accuracy: 0.63
- Number of voxels in mask: mean = 560, stdev = 33
OcFus, TOFus, TFus-P, ITG-P, ITG-TO
- <click back to table>
- Cross-Subject Similarity correlation: 0.8
- Correlation with behavioral similarity: 0.9
- Correlation with V1 model similarity: 0.2
- SVM Accuracy: 0.6
- Number of voxels in mask: mean = 560, stdev = 33
Lingual Gyrus, posterior division
- <click back to table>
- Cross-Subject Similarity correlation: 0.64
- Correlation with behavioral similarity: 0.2
- Correlation with V1 model similarity: 0.53
- SVM Accuracy: 0.57
- Number of voxels in mask: mean = 560, stdev = 33

Inferior Temporal gyrus, anterior and posterior
- <click back to table>
- Cross-Subject Similarity correlation: 0.51
- Correlation with behavioral similarity: 0.71
- Correlation with V1 model similarity: 0.31
- SVM Accuracy: 0.36
- Number of voxels in mask: mean = 560, stdev = 33

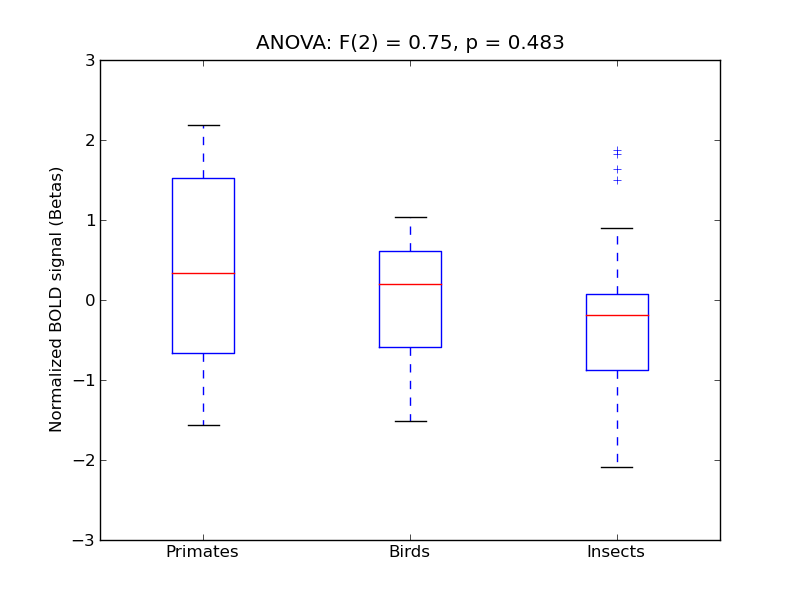
Inferior temporal-posterior and Temporal Fusiform-posterior
- <click back to table>
- Cross-Subject Similarity correlation: 0.43
- Correlation with behavioral similarity: 0.84
- Correlation with V1 model similarity: 0.15
- SVM Accuracy: 0.3
- Number of voxels in mask: mean = 560, stdev = 33
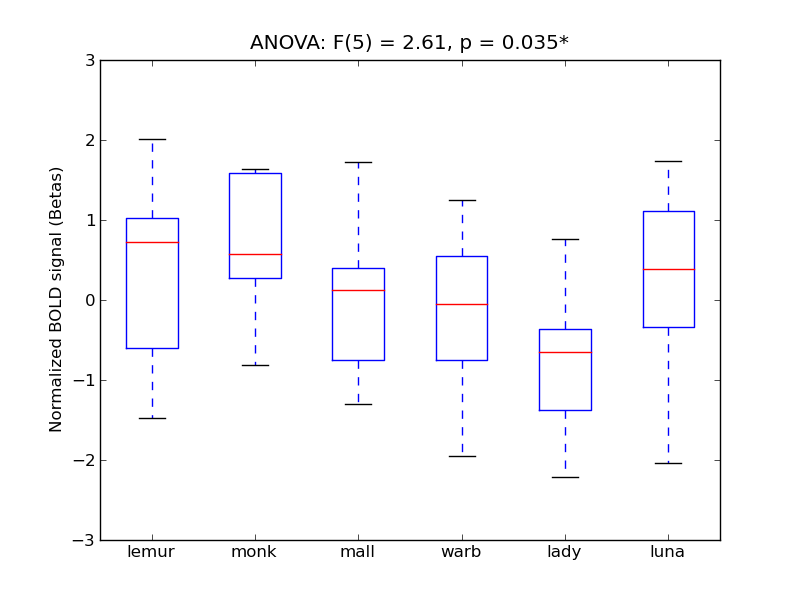
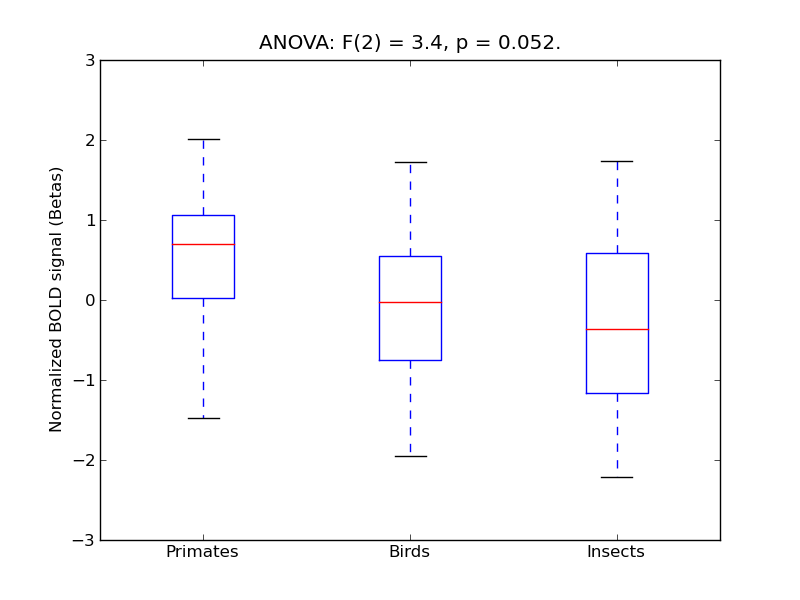
Lingual Gyrus, anterior division
- <click back to table>
- Cross-Subject Similarity correlation: 0.0
- Correlation with behavioral similarity: 0.39
- Correlation with V1 model similarity: 0.22
- SVM Accuracy: 0.26
- Number of voxels in mask: mean = 560, stdev = 33